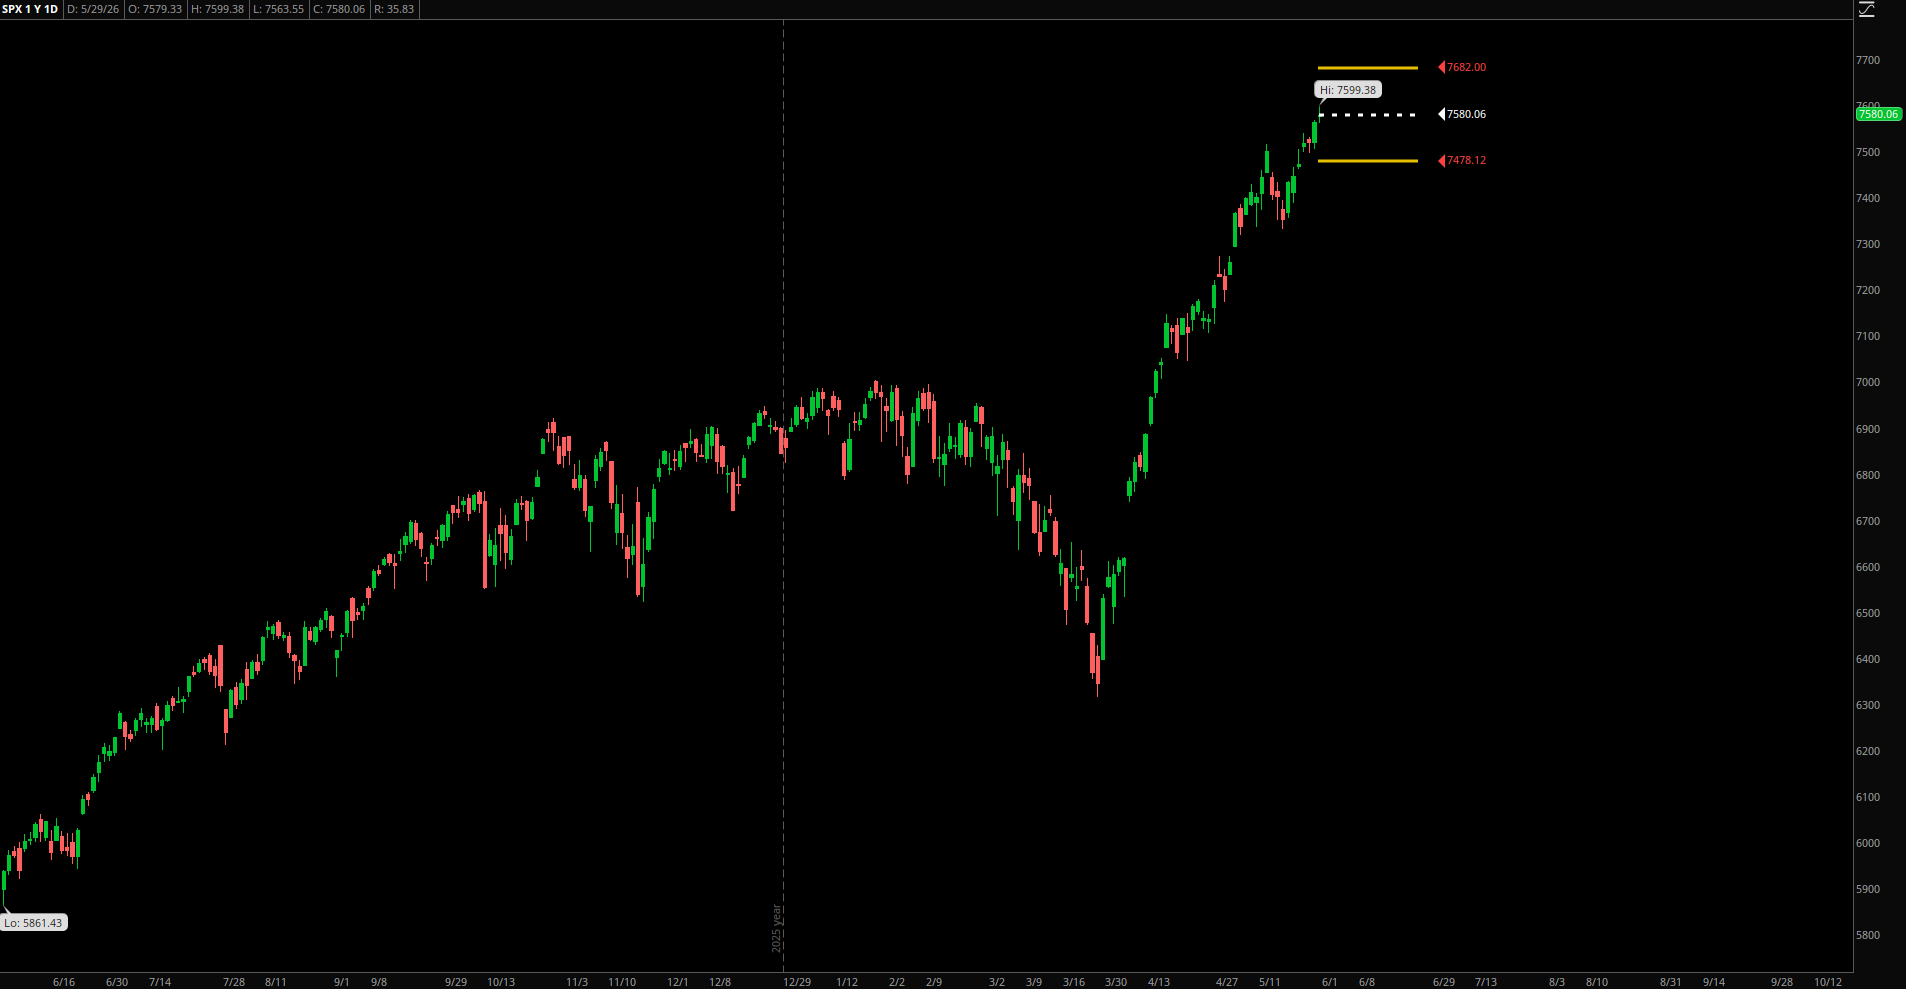
Chasing Peaks: What Happens After the S&P 500 Hits a New All-Time High
Introduction Every time the S&P 500 pokes its head into a new all-time high, it grabs headlines. But does that record pave the way for more upside, or is it often a warning shot before a pullback? From January 2020 through June 2025—an era of easy liquidity and high-frequency trading dominance—we tracked every new all-time…

Timing and Behavior of Overnight and Intraday Extremes in S&P 500 E-Mini Futures (/ES), 2008–2025
Abstract We analyze 4340 trading days of S&P 500 E-Mini futures from January 2008 to May 2025 to understand when daily highs and lows occur and how overnight and intraday sessions interact. We extract minute-level extremes, compute overnight and intraday returns, and test nine hypotheses spanning timing biases, continuation patterns, statistical baselines, gap–volatility relationships, range…

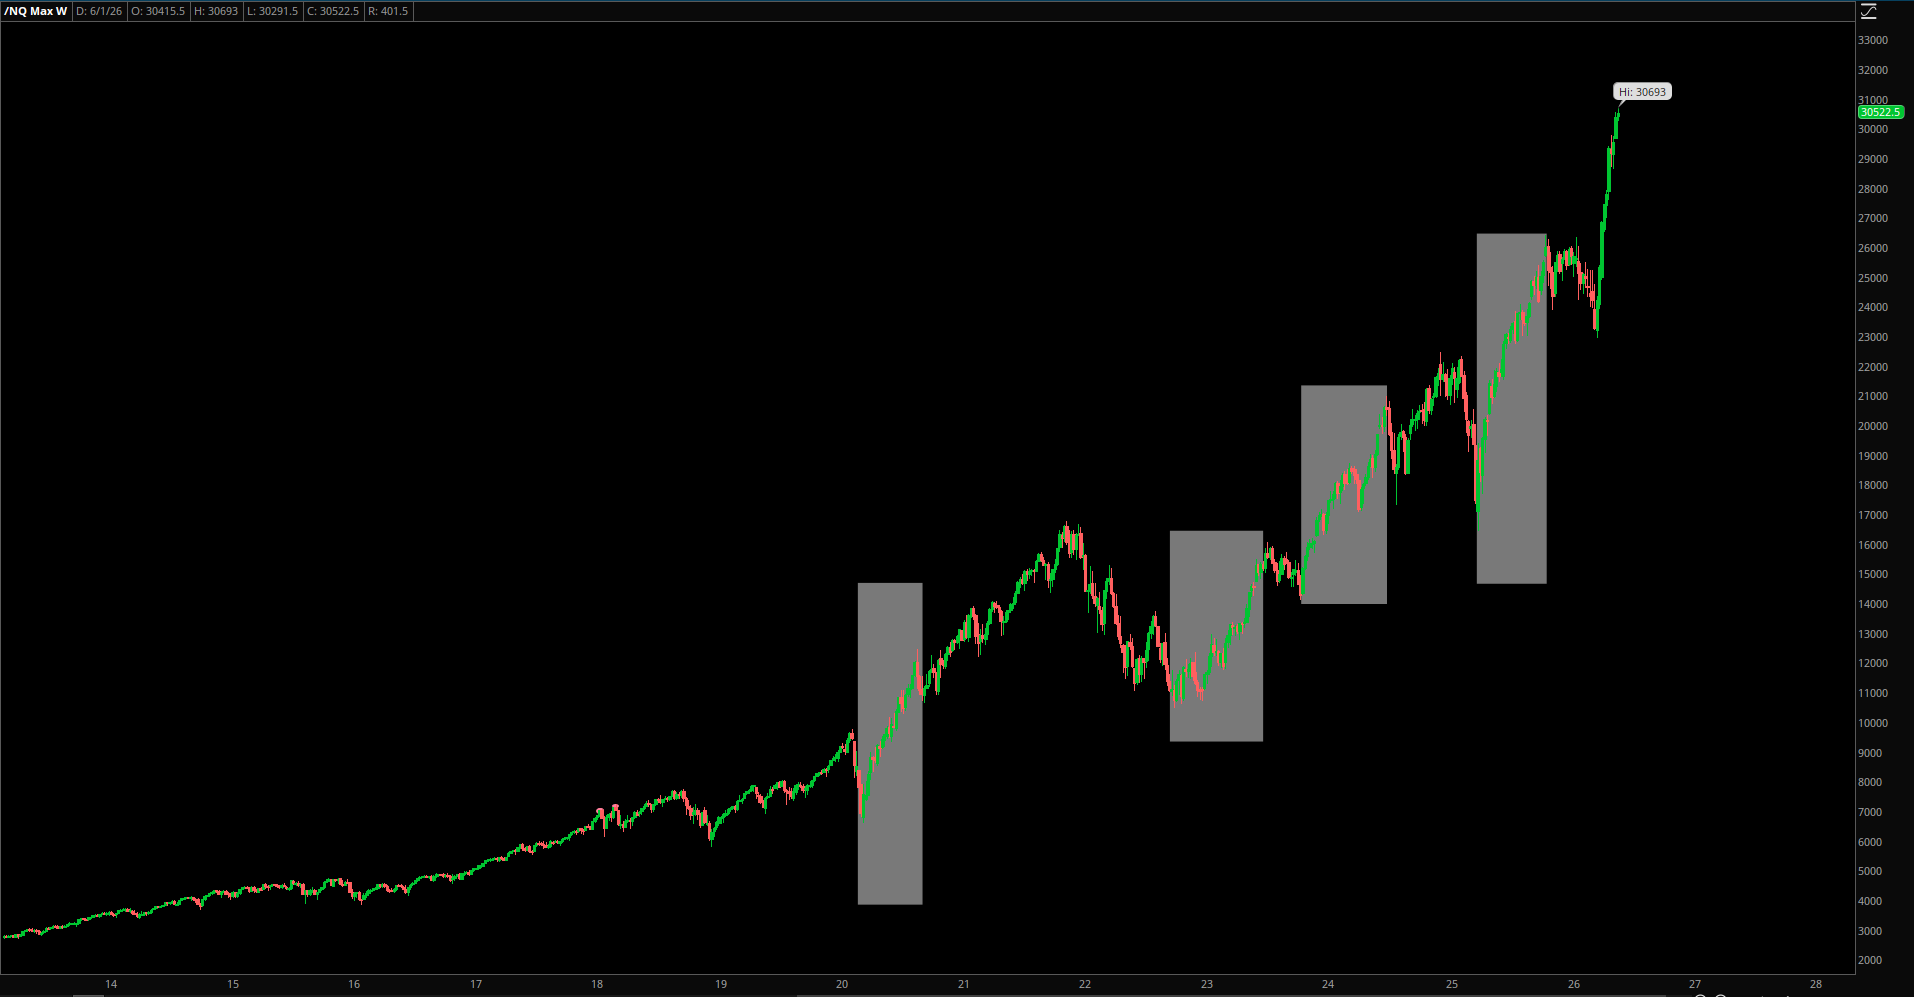
The Rarity of Back‐to‐Back 20%+ S&P 500 Returns
When it comes to stock market performance, investors often watch for those eye‐popping 20%+ annual gains in the S&P 500. While a single 20% year isn’t terribly rare, consecutive such years are a different story. Let’s explore how many times this has happened, the aftermath in each case, and what (little) history can tell us…