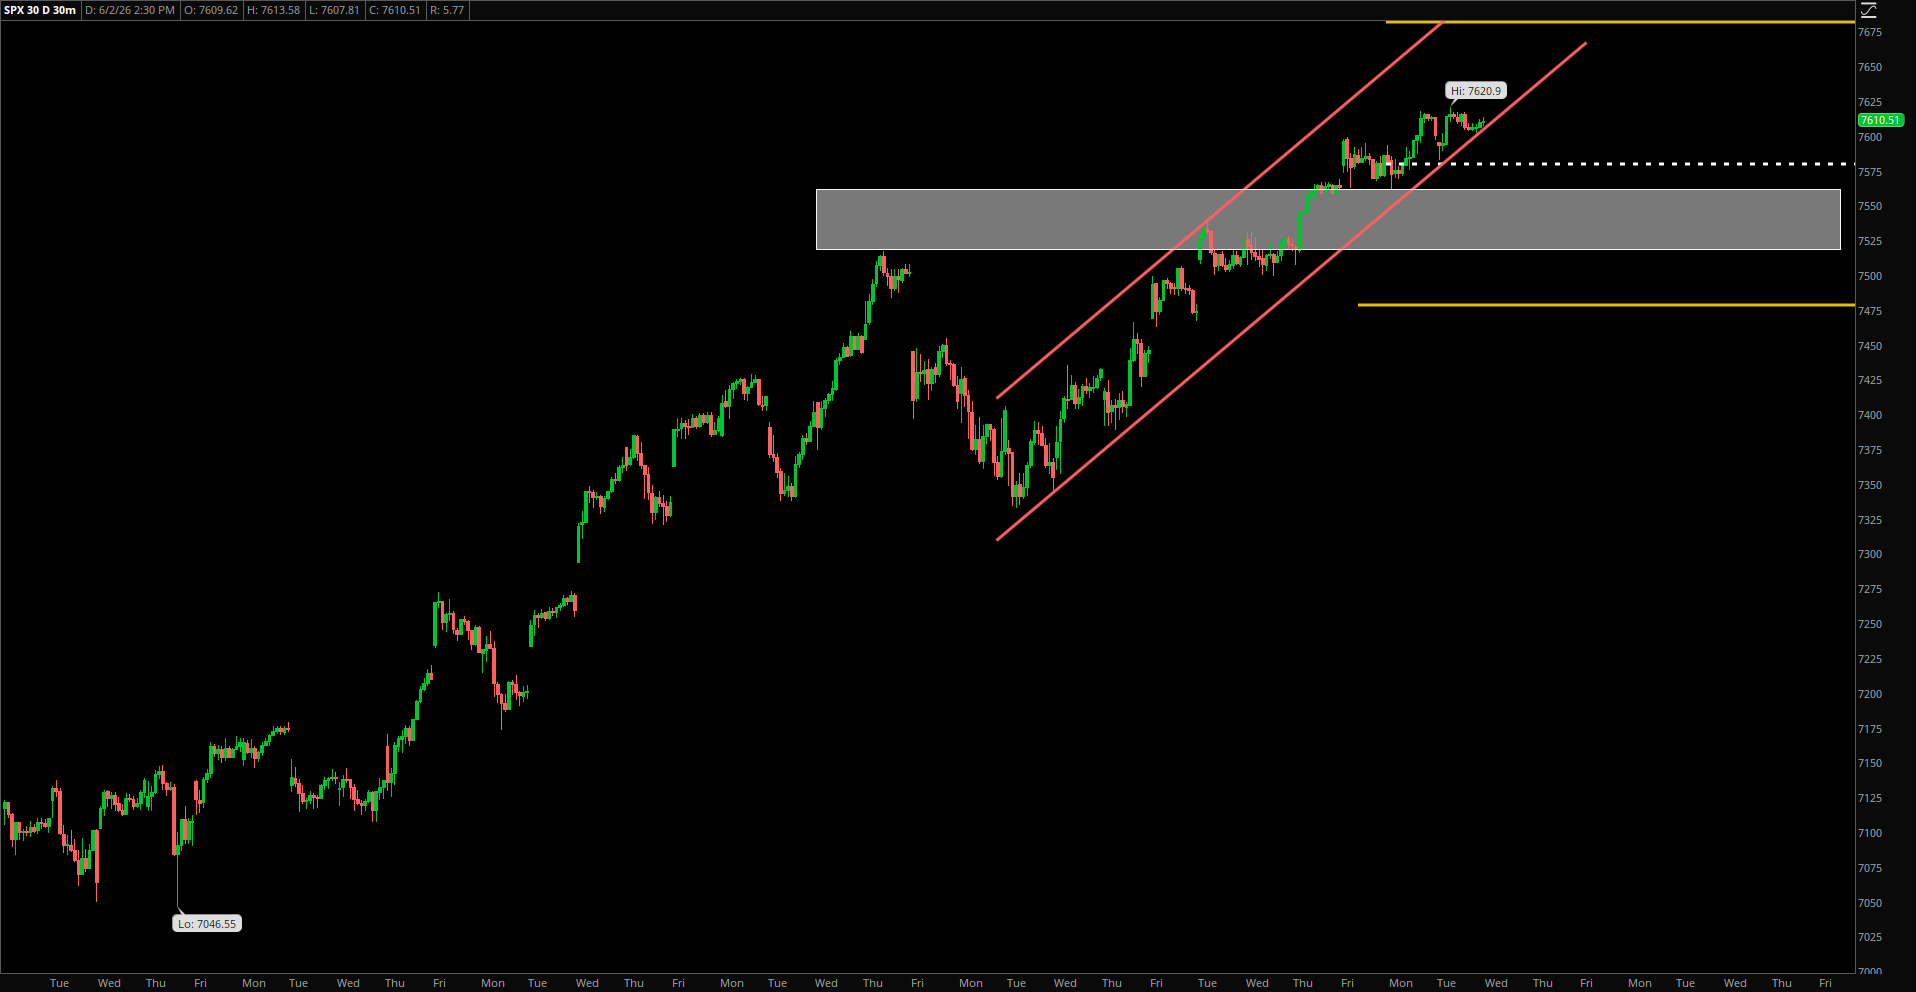
Well it appears that June is going to pick up right where May left off, building on the momentum of the last couple of months. SPX broke through 7600 today and closed just .04 below it. I suppose if you are a bull, it would have been nice to see the close above 7600 as well.
In either case, the barrier has been broken and another milestone has been officially conquered. In May, we saw SPX break 7300, 7400, 7500 and hit a high of 7599. In April, we saw 7000, 7100, 7200 and 7300 all get broken. We are just 1 day into June, but 7600 has already been broken. If the trend continues, is this the month we see SPX break 7700, 7800 and perhaps even 7900?
It is crazy to think about, but if we follow a similar pattern to the last couple of months, 7900-8000 is actually not a crazy idea. It’s been mentioned before, but the market is the strongest when the Nasdaq is leading. SPX is lagging behind NDX pretty heavily, so it actually has room to catch up.
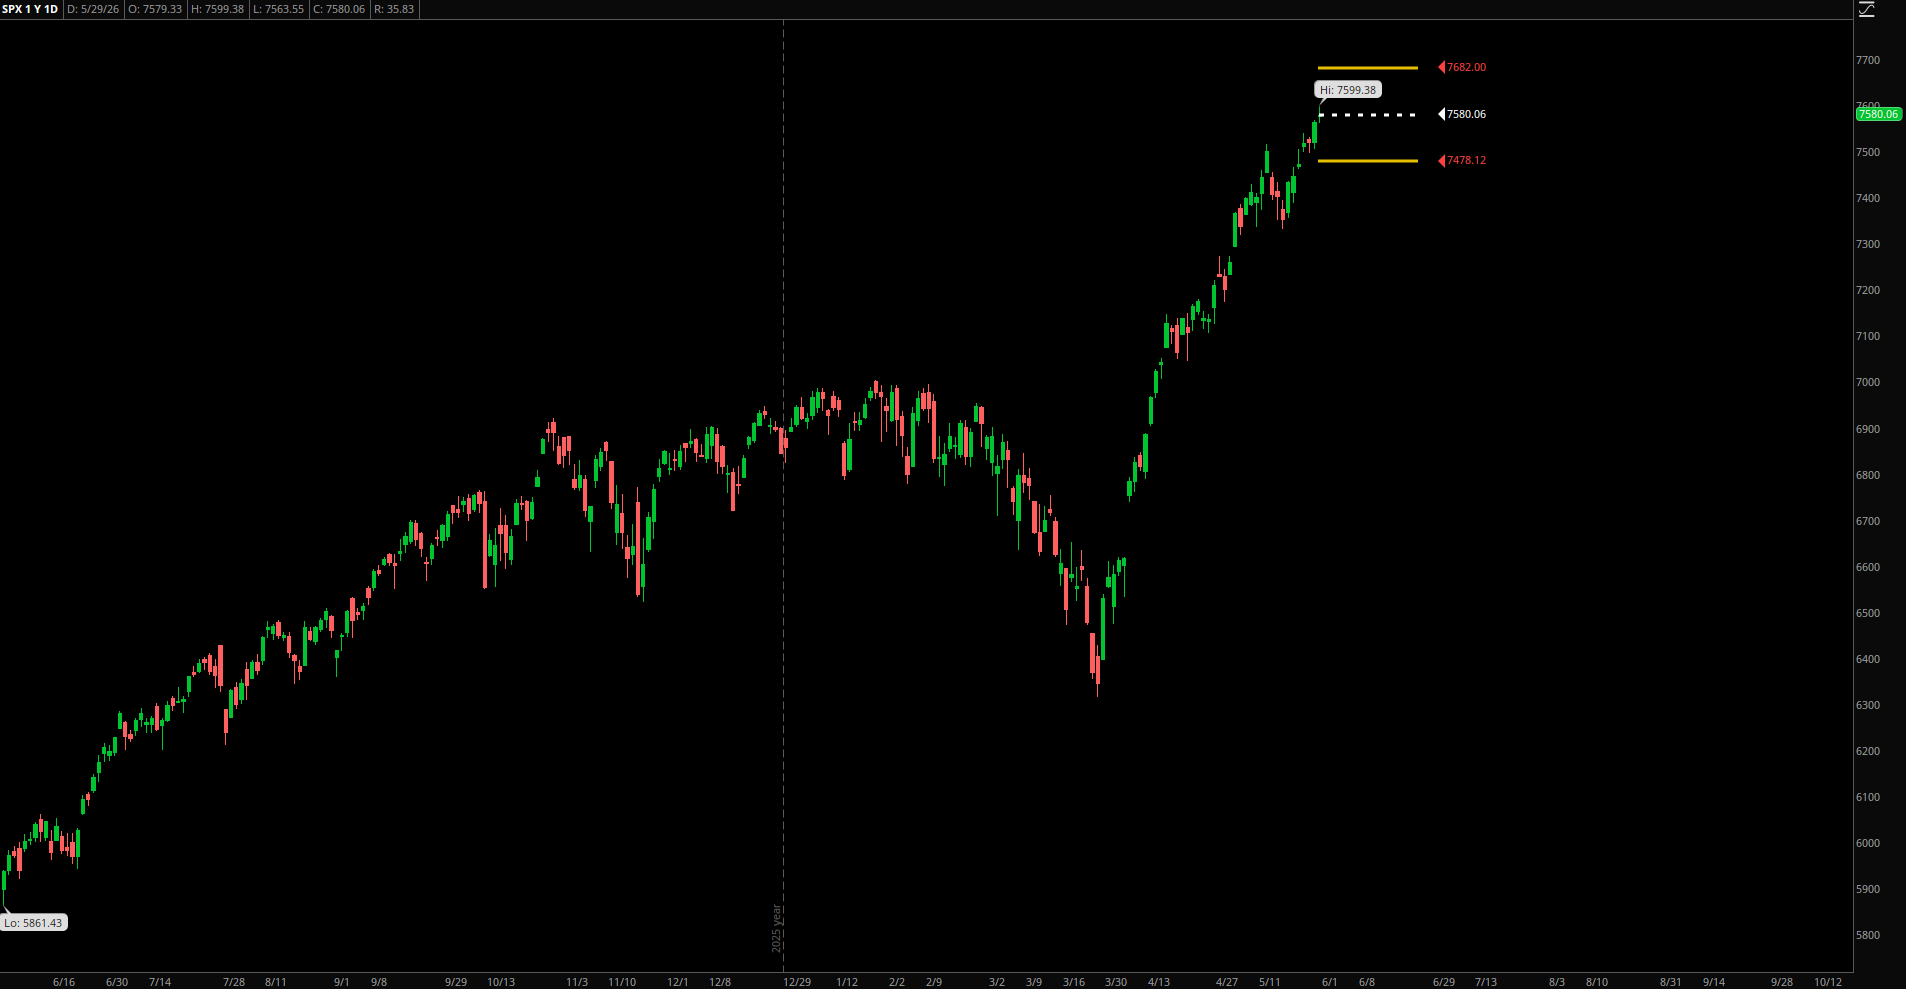
The daily chart looks the same as it always does, a consistent push higher. As we continue to roll into the summer months, we should expect more days like today. A constant, slow drift higher on light volume.

Plus, we can’t forget about the fact that the Iran war ended for the 74th time today. Each ending to the war is worth about 50 points in SPX, so when the 75th iteration of the war ends tomorrow, we can likely expect SPX to push towards 7650.
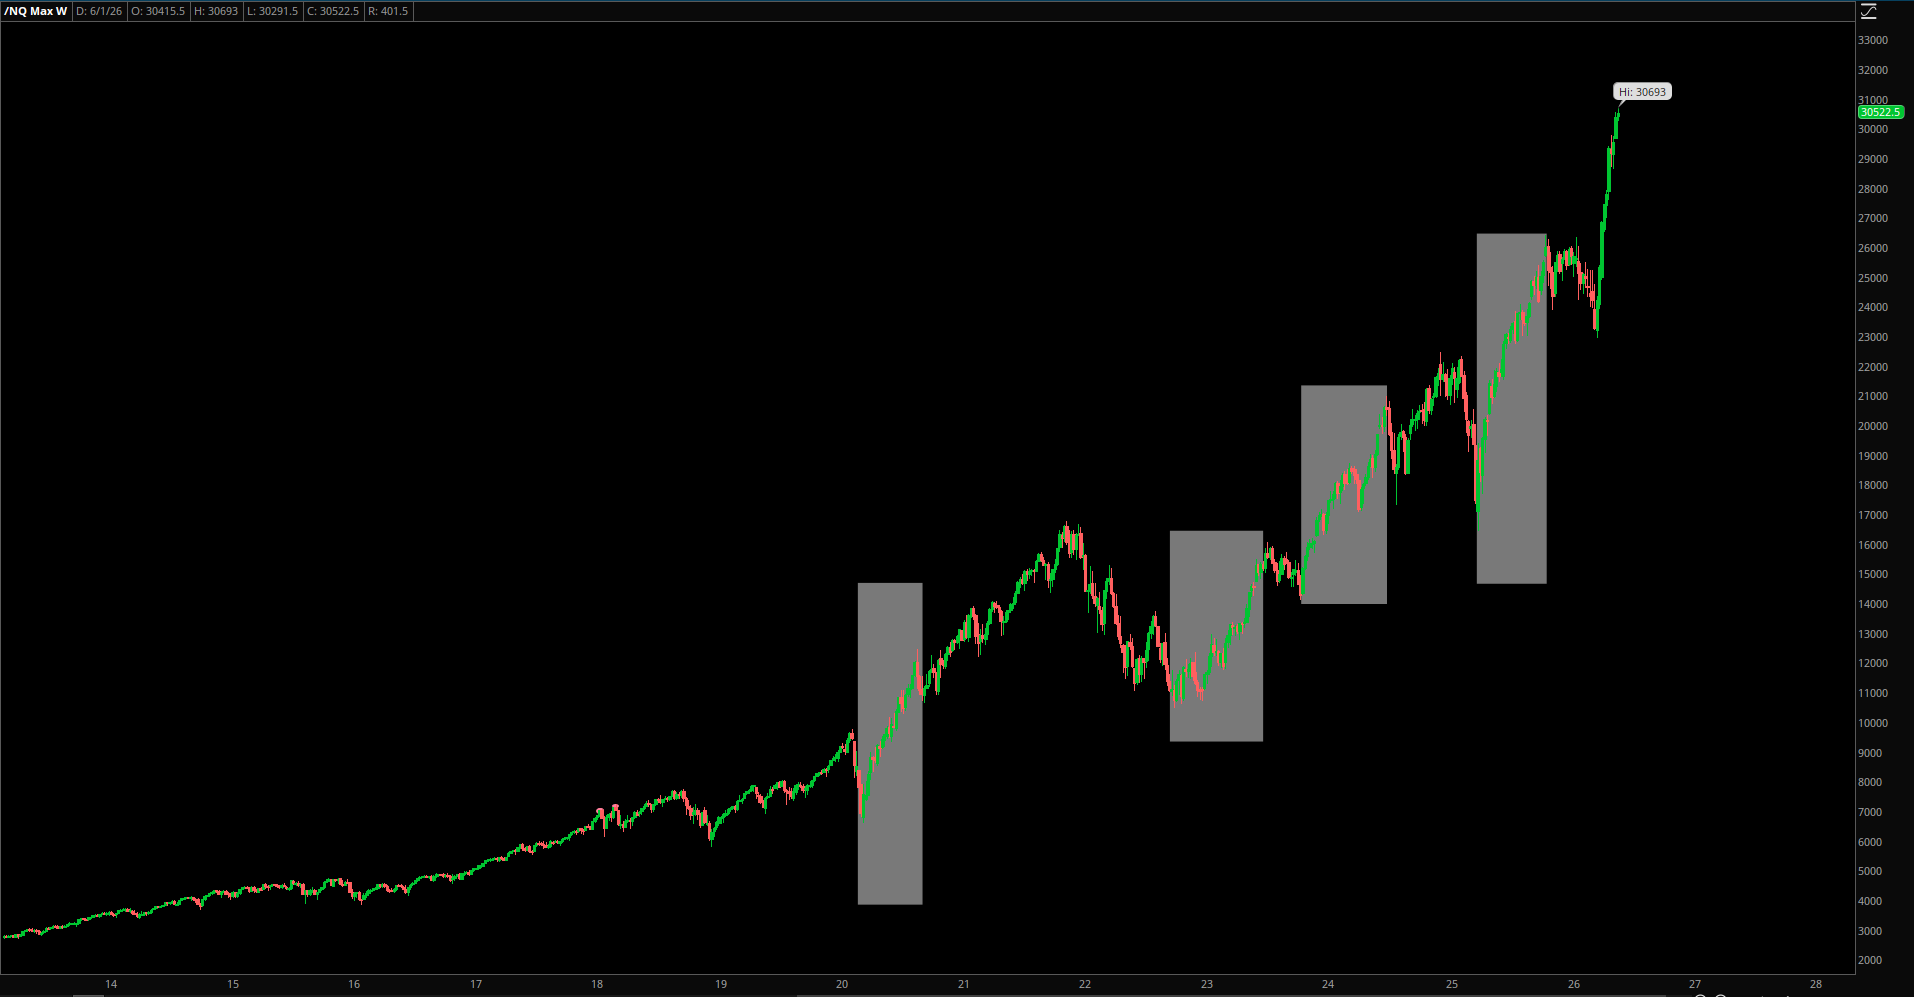
I want to really zoom out and highlight some similar moves in NQ over the last 6 years. Each of the zones highlighted came after a significant downturn. The only difference this time is that we saw NQ only drop about 12% before price shot up. All the previous ones were much more significant to the downside.

Each of those up moves lasted anywhere from 6 to 9 months before any sort of a stall out. I would actually argue that the first box is incorrect and that rally actually lasted just about 2 years, but there was a pullback of about 15% right at the tail end of that first highlighted box, which came after a 6 month rally.
For perspective, we are just 2 months into this current one. Can we see the market run at the same speed for another 4 months? Another 7 months?
That chart isn’t meant to be any sort of analysis or even a prediction, but rather just an observation. I see a lot of people, perhaps rightfully so, think that this rally has gone too far too fast. I am just trying to put into perspective that historically speaking, we have not even scratched the surface yet.
Of course, a 35% move in a major index in just 2 months is ridiculous and perhaps one of the sharpest rallies we have seen in many years. But similar things have happened before, and they never resulted in a “big crash” – At most, maybe someday we will see a 10-15% correction and then a new 6 months rally will begin.
Market sentiment is incredibly bullish. We are seeing 40-50% overnight moves in stocks that have been irrelevant for years. As of writing this, HP is up almost 50% after hours. DELL is up 250% year to date. CSCO is hitting new all-time highs and has nearly doubled in the past year.
It’s not even a rotation out of big names into smaller names that have been lagging behind, it’s a full court press across the board for anything that even mentions the word AI.
This party is not ending any time soon. There is too much money to be made. Maybe all the doomers are right, but nobody cares right now because they’re handing out free money.
Go long or get left behind.

Leave a Reply