Brick Walls or Paper Lines? I Tested 1,085 Days of SPX 0DTE Gamma Levels
I rebuilt the 0DTE gamma board minute by minute for 1,085 SPX sessions and tested every wall, flip and pin against random lines. Then I tried to scalp them. Here’s what held up and what didn’t.
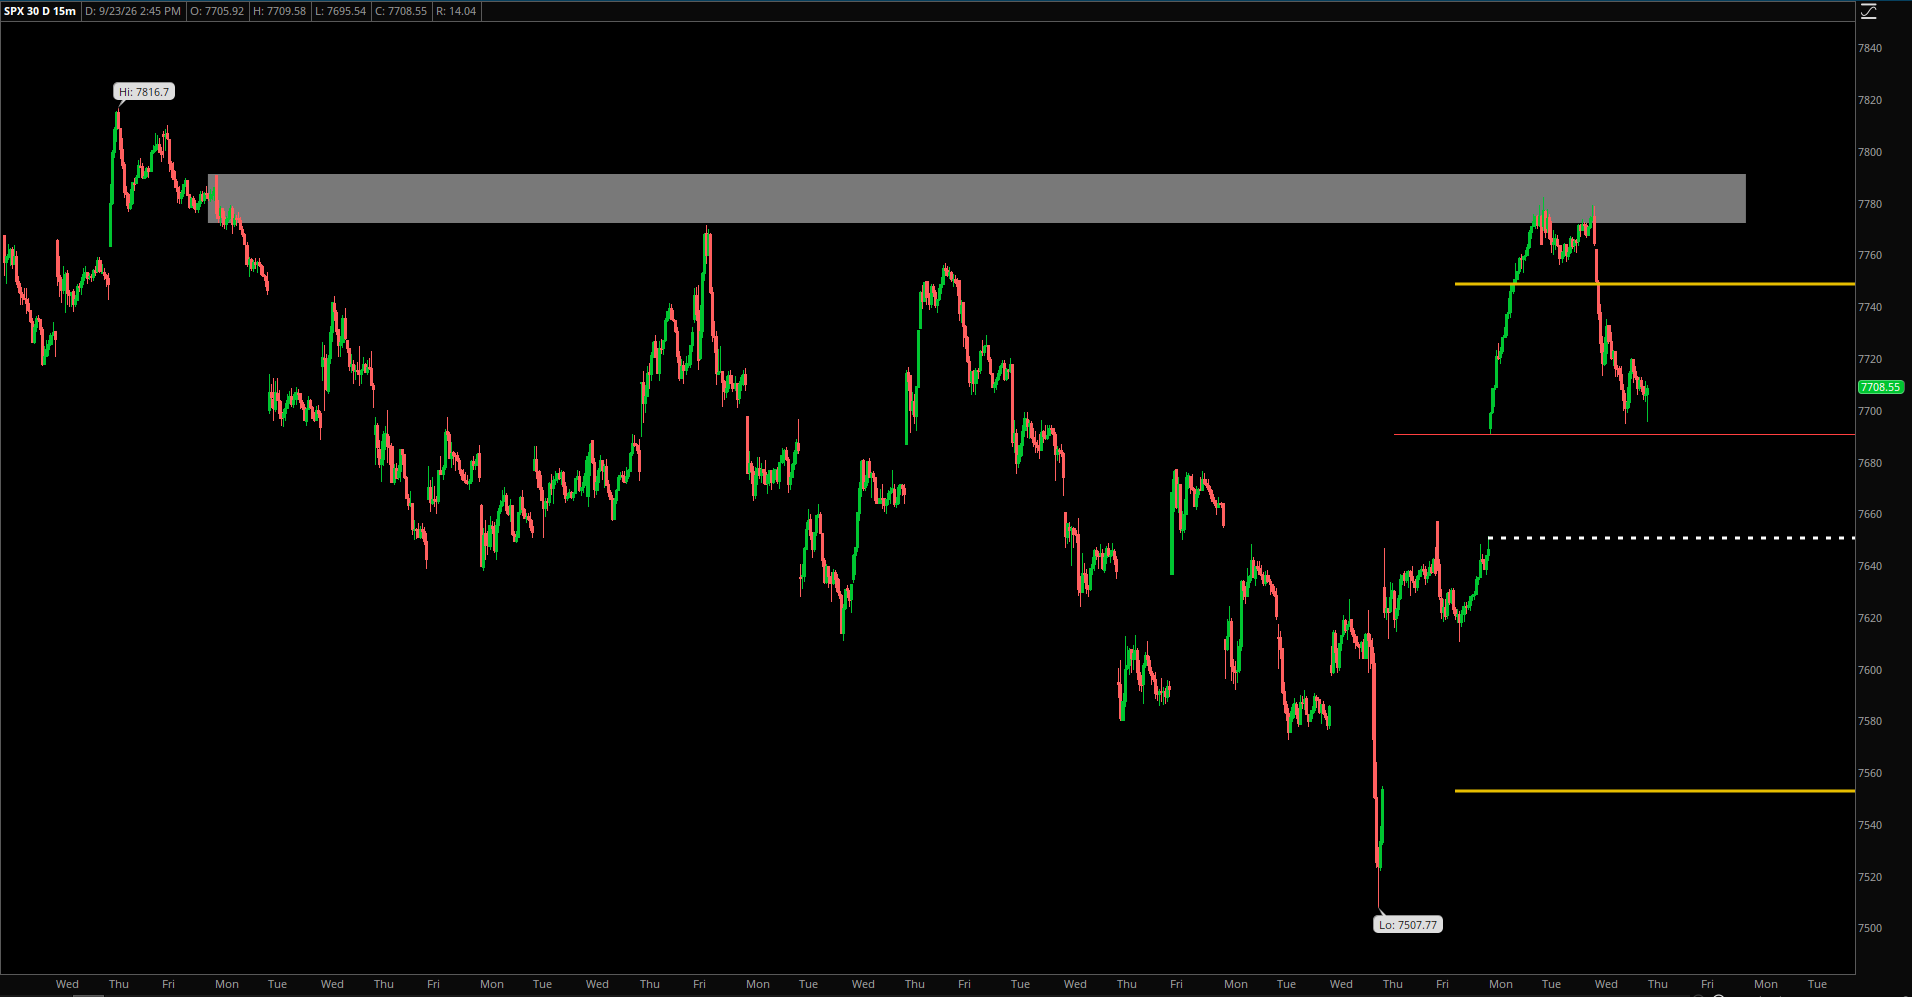
If you read my daily updates, you’ve seen me call a big call wall a “brick wall” more than once. Just recently (September 2026), the 7775–7790 area on the gamma table capped SPX, and it held. It’s one of the most repeated ideas in 0DTE trading: walls hold, the flip is a pivot, the pin pulls price in at the close.
But does any of that hold up when you test it on every day, not just the days we remember? And if walls really do hold, can you just fade them for 5–10 points?
Rather than argue about it, I tested it. I rebuilt the SPX 0DTE gamma board for every session from May 16, 2022 to September 25, 2026, 1,085 days in all, and ran two studies:
- Level Reaction Stats: do the levels on the board hold more often than an ordinary/random line would?
- Can you scalp the walls? A mechanical backtest of fading every touch.
The full results for Study 1 are now live on the dashboard at dashboard.datafortraders.io/levels and update nightly. Here’s what I found.
1. Data and Methodology
1.1 Rebuilding the board
For each day, the 0DTE (SPXW) gamma levels were rebuilt minute by minute from historical greeks plus that morning’s open interest. I used the exact same math as the live dashboard:
- GEX = Gamma × OI × 100 × Spot² × 0.01
- Calls count positive and puts count negative. This is the standard public-data approximation: customers are assumed to be long calls and short puts. It is not actual dealer positioning. Nobody outside the dealers has that.
Nine half-days and one day with missing bars were excluded, which leaves 1,085 sessions.
1.2 Does the rebuild match the live dashboard?
A backtest is only useful if it’s testing the same thing you see on screen. I checked it against the live system:
| Parity check | Result |
|---|---|
| Intraday net GEX correlation | 0.997 |
| Walls / pin at 15:59 (spot-check day) | Identical |
| Expected move vs. live value | Within 1.4% on average |
1.3 Levels tested
Call walls #1–3, put walls #1–3, gamma flip, pin, expected-move high/low, VWAP, prior close, and the day’s high/low.
1.4 What counts as a “test,” a “hold” and a “break”
Every rule scales with that day’s expected move (EM). At a typical ~50-point EM, it works out to this:
- Test: SPX has been at least ~10 points away from the level, then trades within ~2 points of it.
- Held: a 1-minute bar closes ~6 points back on the side price came from, before any bar closes ~6 points through.
- Broke: the reverse.
- Undecided: neither happens within 30 minutes.
1.5 The baseline problem (the most important part of this post)
Under these rules, even a random line “holds” about 61% of the time. The test starts with price on the near side of the line, so the near side has a head start.
A statistic like “the call wall held 62% of the time” sounds impressive, but on its own it means almost nothing. The only fair comparison is against:
- Matched random lines: ordinary strikes that aren’t on the board, tested in the same gamma regime, at the same time of day, from the same direction.
- A shuffle control: other days’ levels dropped onto the same day’s candles. If yesterday’s walls “work” on today’s chart as well as today’s walls do, the level itself isn’t doing the work.
Confidence intervals come from a bootstrap clustered by day, and I applied multiple-testing controls, because with this many levels × directions × regimes, something will always look good by luck.
2. Study 1 Results: Does the Board Beat a Random Line?

| Held % | |
|---|---|
| All board levels | 62.0% |
| Matched random lines | 61.4% |
| Difference | +0.6 pp (90% CI −0.4 to +1.7) |
Insight: As a group, the board adds nothing measurable to hold rates. Other days’ levels dropped onto the same candles beat random lines by +0.9 pp, at least as much as today’s actual levels did. The 62% figure mostly reflects how the test is defined, not the levels.
Walls specifically: once you control for other days’ walls, the wall hold rate is roughly the same as random. Walls do see more chop: call walls finished undecided 25% of the time vs. 18% at random lines. Other levels show that too, though, so it isn’t unique to walls.
Walls and pin at the close:
| Close behavior | Board level | Random |
|---|---|---|
| Walls contained the close | 61.6% | 61.8% |
| Pin pulled the close | 26.6% | 27.1% |
Insight: Neither beat chance. The pin did not pull the close any more than a random strike did.
3. Where the Levels Do Matter
The board as a whole doesn’t beat random, but a few specific findings stood out. Here’s where it gets interesting.
3.1 Gamma regime predicts range

| Regime | Days | Median range after 10:00 (× EM) |
|---|---|---|
| Positive gamma | 606 | 0.94× |
| Negative gamma | 479 | 1.10× |
| Difference | +0.16× EM (90% CI +0.11 to +0.20) |
Insight: On negative-gamma days, the range after 10:00 is a median 0.16× EM wider. That’s roughly 7 points at a typical 44-point EM. This is the most robust finding in the study. It’s an association, not proof of cause, but if you size your stops and targets around the day’s range, regime is worth checking.
3.2 The gamma flip from below
When the flip was approached from below with no other level nearby, it held 68.4% of the time. This one survives multiple-testing control.
3.3 Prior close from above is break-prone
| Prior close tested from above | Held % |
|---|---|
| All days | 55.8% |
| Random lines | 62.1% |
| Difference | −6.3 pp |
| Negative-gamma days only | 49.8% |
Insight: Coming down into yesterday’s close, the line is more likely to give way than a random line. On negative-gamma days it’s roughly a coin flip.
3.4 The expected move does what it says
SPX closed inside ±EM on 69% of days, against a theoretical 68.3% for a 1-standard-deviation move. It was 76% after weekends and holidays vs. 67% on other days.
4. Study 2: Can You Scalp the Walls?
This is the one I really wanted to know. A common claim is that you let price pierce the wall by a few points, fade it, and collect a 5–10 point bounce. So I tried to trade it.
4.1 Setup
- Trades: every armed touch at call walls #1–3 (short), put walls #1–3 (long), and the flip and pin (both directions), across the same 1,085 days.
- Bars: SPX 1-minute bars treated as /ES points ($50/pt).
- Entries: at the touch, a limit at the level, or a limit 2 or 4 points through.
- Stops: 2–8 points. Targets: 3–10 points. Max hold: 30 minutes.
- Conservative fills: a limit has to trade through by 0.25 to fill, and a bar that hits both stop and target counts as a stop.
- Costs: 0.5 point round trip (0.25 and 0.75 also tested).
- Controls: the same trade at random 5-point strikes and at lines offset +2.5 points, matched on time of day, regime, first touch vs. retest, and approach speed.
- Out of sample: configurations were chosen on 2022-05 → 2025-09, then scored, untouched, on 2025-10 → 2026-09.
- Sanity check: we ran the simulator on synthetic random-walk days to confirm it isn’t biased.
4.2 Results
No configuration is profitable after costs. None, even at 0.25 point costs, and almost none even before costs.
An example configuration: put walls, entry at the touch, 4-point stop / 5-point target:
| Metric | Value |
|---|---|
| Winning trades | 39% |
| Avg win | +4.32 pts |
| Avg loss | −4.40 pts |
| Net per trade | −1.05 pts (90% CI −1.16 to −0.93) |
| Same trade at random lines | −1.25 pts |
Always-on wall scalping (one position at a time) over the full period:
| Strategy | Total |
|---|---|
| Fade put walls | −3,232 pts |
| Fade call walls | −3,027 pts |
Insight: Both lose in every year from 2022 to 2026, in both gamma regimes, and in every time-of-day bucket. The only in-sample winner was long at the pin tested from above, at +0.05 pt/trade. Out of sample it lost −1.16 pt/trade.
4.3 So is the bounce real?
Yes, and that’s why this idea is so convincing. After a touch, walls bounce 5+ points within 30 minutes 50–68% of the time, with a median pierce of only 0.7–1.7 points. That matches what traders describe seeing.
The catch is that random 5-point strikes do it 67–70% of the time. The bounce is real, but you’d see it at almost any line.
Walls do react slightly better than random lines, by +0.1 to +0.4 pt/trade, most consistently at call walls and at the flip from below. That edge is real, but it’s much smaller than transaction costs.
4.4 Why fading loses
Once price has traveled to a line, it tends to carry through more than chance would suggest. Stops were hit 62% of the time vs. 55% on a random walk. Price usually arrives at a wall with momentum, and a mechanical fade is trading against it.
4.5 “But the walls have been respected all week”
I tested that too. Weeks where walls held well over the prior 5 days did not predict the next day. The highest-respect tercile was actually the worst.
5. Key Takeaways
- The 61% trap: Under a near-side test, any line “holds” about 61% of the time. A hold % without a random baseline tells you very little.
- Board levels ≈ random lines: 62.0% vs. 61.4% overall, and other days’ levels did just as well on the same candles.
- Regime matters for range: negative-gamma days run a median ~0.16× EM wider after 10:00 (about 7 points on a typical day).
- A few specific setups stand out: the flip from below (68.4% held, with no other level nearby), and prior close from above, which breaks more often than random lines.
- Fading walls mechanically loses: that includes every year, both regimes, every time bucket and out-of-sample testing. The edge vs. random (+0.1 to +0.4 pt) is smaller than costs.
- The expected move is well calibrated: 69% of closes landed inside ±EM, vs. 68.3% theoretical.
6. Final Thoughts & Disclaimers
- Modeled, not known: Levels are modeled from open interest using a public-data approximation, not from actual dealer positions.
- Morning OI only: OI is the 6:30 AM print, so intraday 0DTE opening flow isn’t included.
- 1-minute resolution: Bars can’t see sub-minute tape. This study tests mechanical entry at every touch, not a discretionary trader reading the tape at the level. Those are different things.
- SPX vs. ES: SPX cash was used as a proxy for ES, and their microstructure isn’t identical.
- History isn’t a forecast: Past behavior over 2022–2026 doesn’t guarantee anything about the next four years.
Bottom line: This doesn’t mean I’m going to stop watching the walls. The levels are useful as reference points and context, and gamma regime really does tell you something about how much room the day has to move. But a level by itself isn’t an edge. If there is one, it comes from what you do at the level: reading the tape, the context and the reaction. Just touching a line on the board isn’t enough.
Every level, direction and regime from Study 1 is on the new Levels page at dashboard.datafortraders.io/levels, and it updates nightly. Dig in, check your favorite level against its random baseline, and let me know what you find.
Not investment advice. The data here is meant to inform, not to tell you what to trade.
Good luck!


Leave a Reply