The key levels coming into today were 7650 and 7750. SPX found the magnet at 7750 and stayed around there most of the day. This level also aligned with the upper end of the expected move, which is where SPX ended up finishing almost to the dot. 7748 was the 1 standard deviation move and SPX closed at 7743.
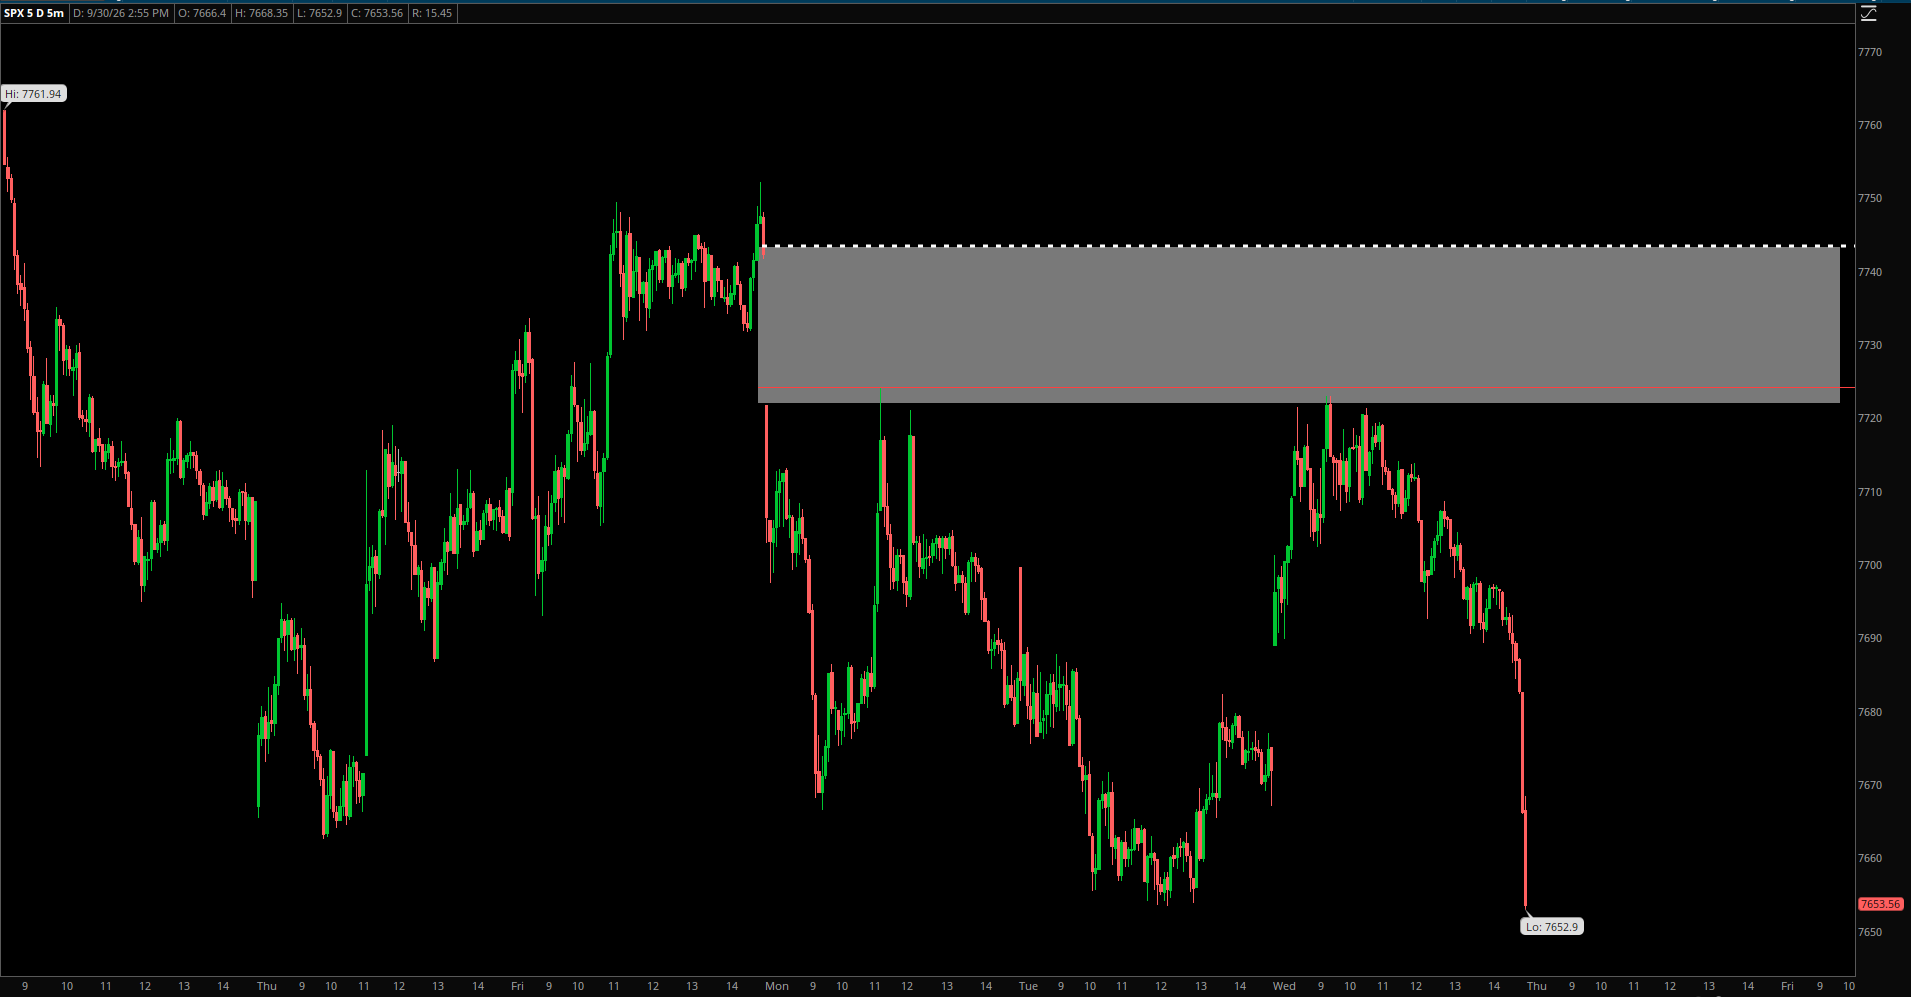
It was a roller coaster week, where on Monday we broke the expected move to the upside, and by Thursday morning we were just about unchanged on the week. By Friday close, SPX is right back at the upper end of the expected move.
The daily chart continues the whipsaw, as SPX is unable to pick a sustained direction. It’s been a series of a few days up, a few days down, but it ends up no where. September is winding down and SPX is still right about where it was at the start of the month. It’s been volatile, but directionless.

It’s a pretty messy chart. I don’t think anyone can convincingly argue that it is bullish or bearish. Both sides seem to be going no where, which is why I am so focused on just the short term and day to day key levels. The long term trend just isn’t there right now.
The 7780 area is likely the major wall keeping SPX from hitting all time highs. As we head into next week, this will be the level to watch for as we seem to be approaching it again.

Overall, the week was bullish mostly bailed out by Monday and Friday. The middle of the week actually looked more bearish than the start and finish of it.
September comes to an end next week and October takes over, which is known to be another volatile month. We haven’t seen VIX really pop like I have been calling for, but I still do think that we are overdue.
I’ll have more about that in my weekend video, as well as the expected move and other key levels to watch for.
Stay tuned!


Leave a Reply