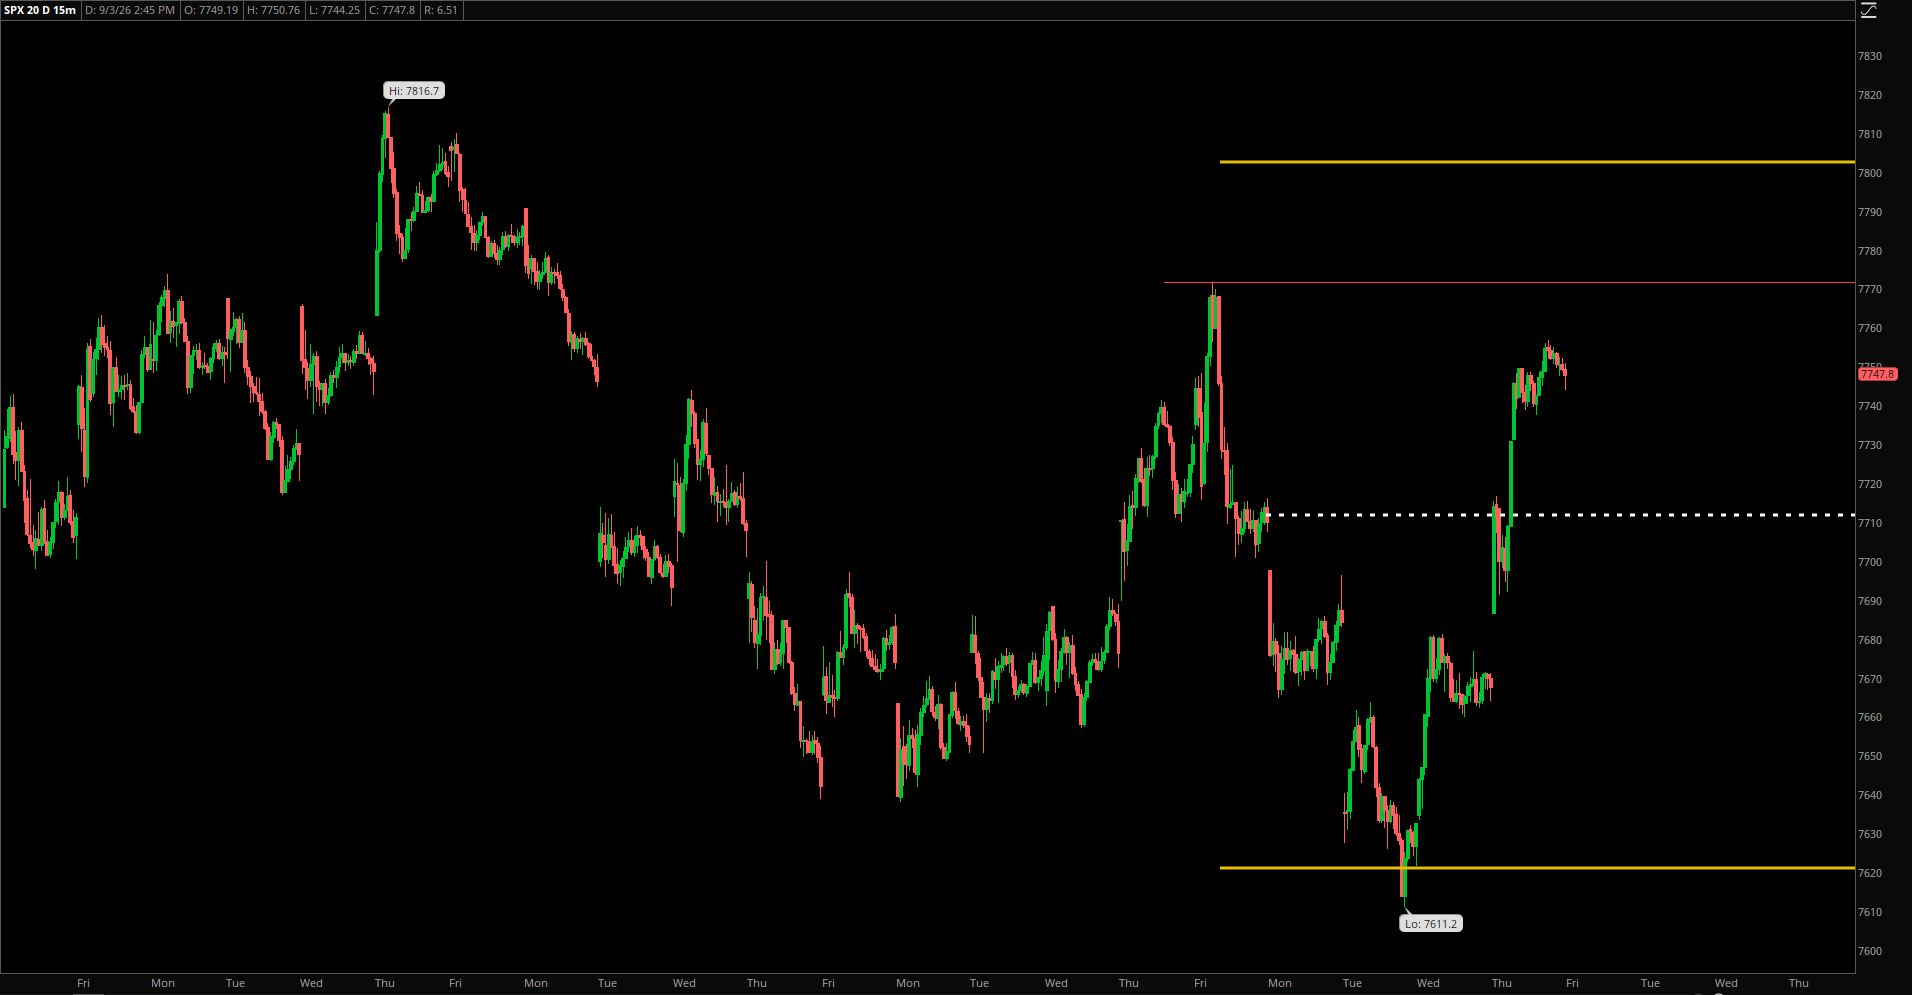
The theory coming into today was that SPX would make it’s way down to the lower end of the expected move and it did exactly that. The low today was 7624, just 3 points shy of the official expected low of 7621.
The downside follow through continued today and even though SPX did not close at the lows of the day, I think it is fair to say that we have just experienced a short term down trend. This is the 3rd down day in a row, all with a very similar look and feel.
The daily chart rollercoaster continues to play out as well. The last 3 red candles have erased most of the up move from last week that had a very similar look and feel to it. On Tuesday last week, we tagged the lower end of the expected move and by Thursday we were almost at the upper end.

And so here we are again, on the 2nd trading day of the week, tagging the lower end of the expected move.
If the roller coaster is to be believed, then actually we should be heading back up the slope tomorrow. Perhaps PPI and CPI are just the catalyst we need?
The downward channel we started tracking yesterday is also playing out perfectly so far. The tag of the upper bound last week has reversed down and we are making our way to the lower bound. For the time being however, the lower end of the expected move is playing out as a support level which was also expected. It will take a lot to break, but if it does then certainly 7600 or below can easily happen.

But as I mentioned earlier, last week we also tagged the lower end of the expected move on the 2nd trading day, and then rallied back up and closed the week unchanged.
This is the next big test for dip buyers and bulls. Can they defend this 7620 area in back to back weeks?
A rollercoaster market means mixed signals and it makes short term trading basically a coin toss. Zooming into the shorter time frame charts, we have a downward channel that seems to still be trending down. Meanwhile, the daily chart shows a similar pattern to last week where we held the lower end of the expected move and bounced.
Something tells me that the week won’t close here. That is probably the only statement I believe about this market. It doesn’t take a genius to say “we are either going up or down” but I’ll elaborate on that a bit. I think we are either headed for a 1.5 to 2 standard deviation move to the downside, or the market closes unchanged for the week.
I’ll end on a note of introducing more confusion…

Just about 2 years ago, if you showed someone that image and only that image, and had them guess the net change on SPX… they would probably guess -2% or -3%, and the real answer of 0.48% would likely shock them.
The indicator says broad selling… but can you feel it?
The inflation data parade starts tomorrow. Let’s hope for some more volatility.


Leave a Reply