SPX closed out a wild week in pretty spectacular fashion today. Price action was all over the place and SPX had some pretty big swings in both directions.
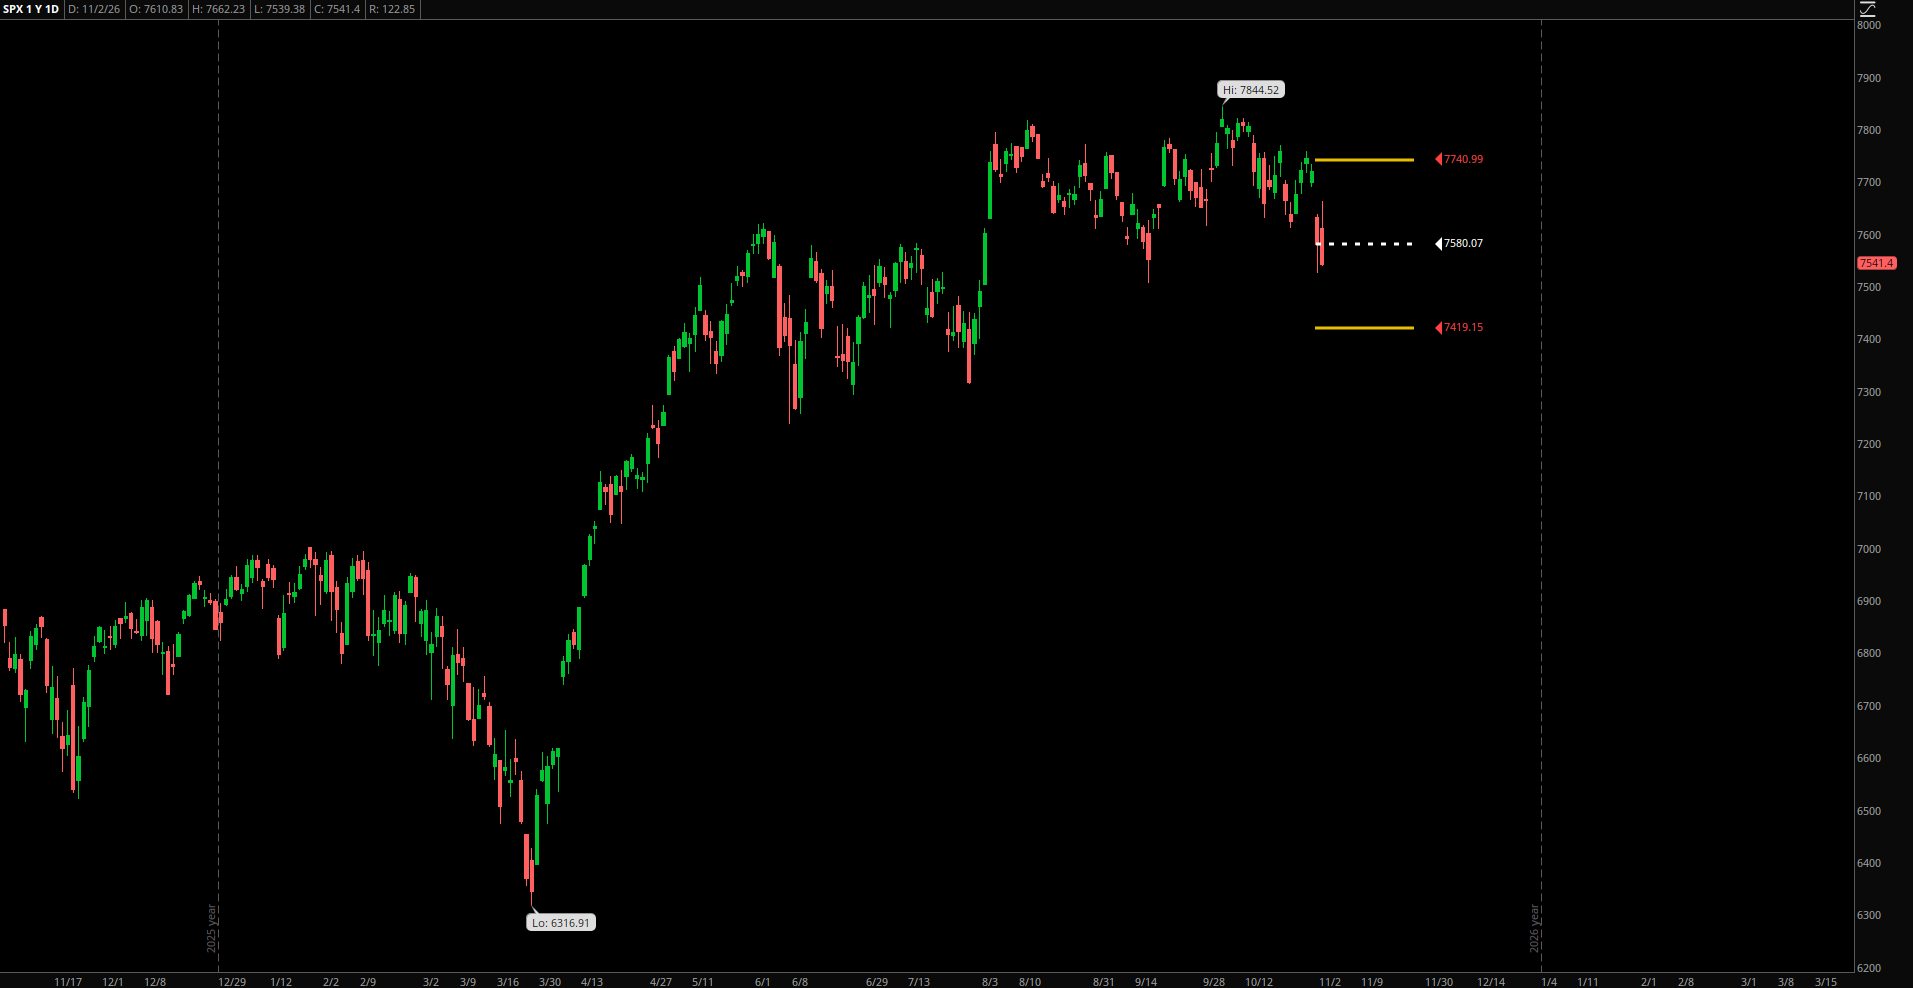
We started the first half of the day selling off and making another set of new lows for the current down move. At one point, SPX was over 1% outside of the expected range. Ultimately, we rallied back and closed within the expected move. From low to high, SPX had a 122-point swing, or just over 2%. That is an incredible intra-day rally.
On the daily chart, SPX broke the 6 red candle streak. The current candlestick pattern indicates a reversal.

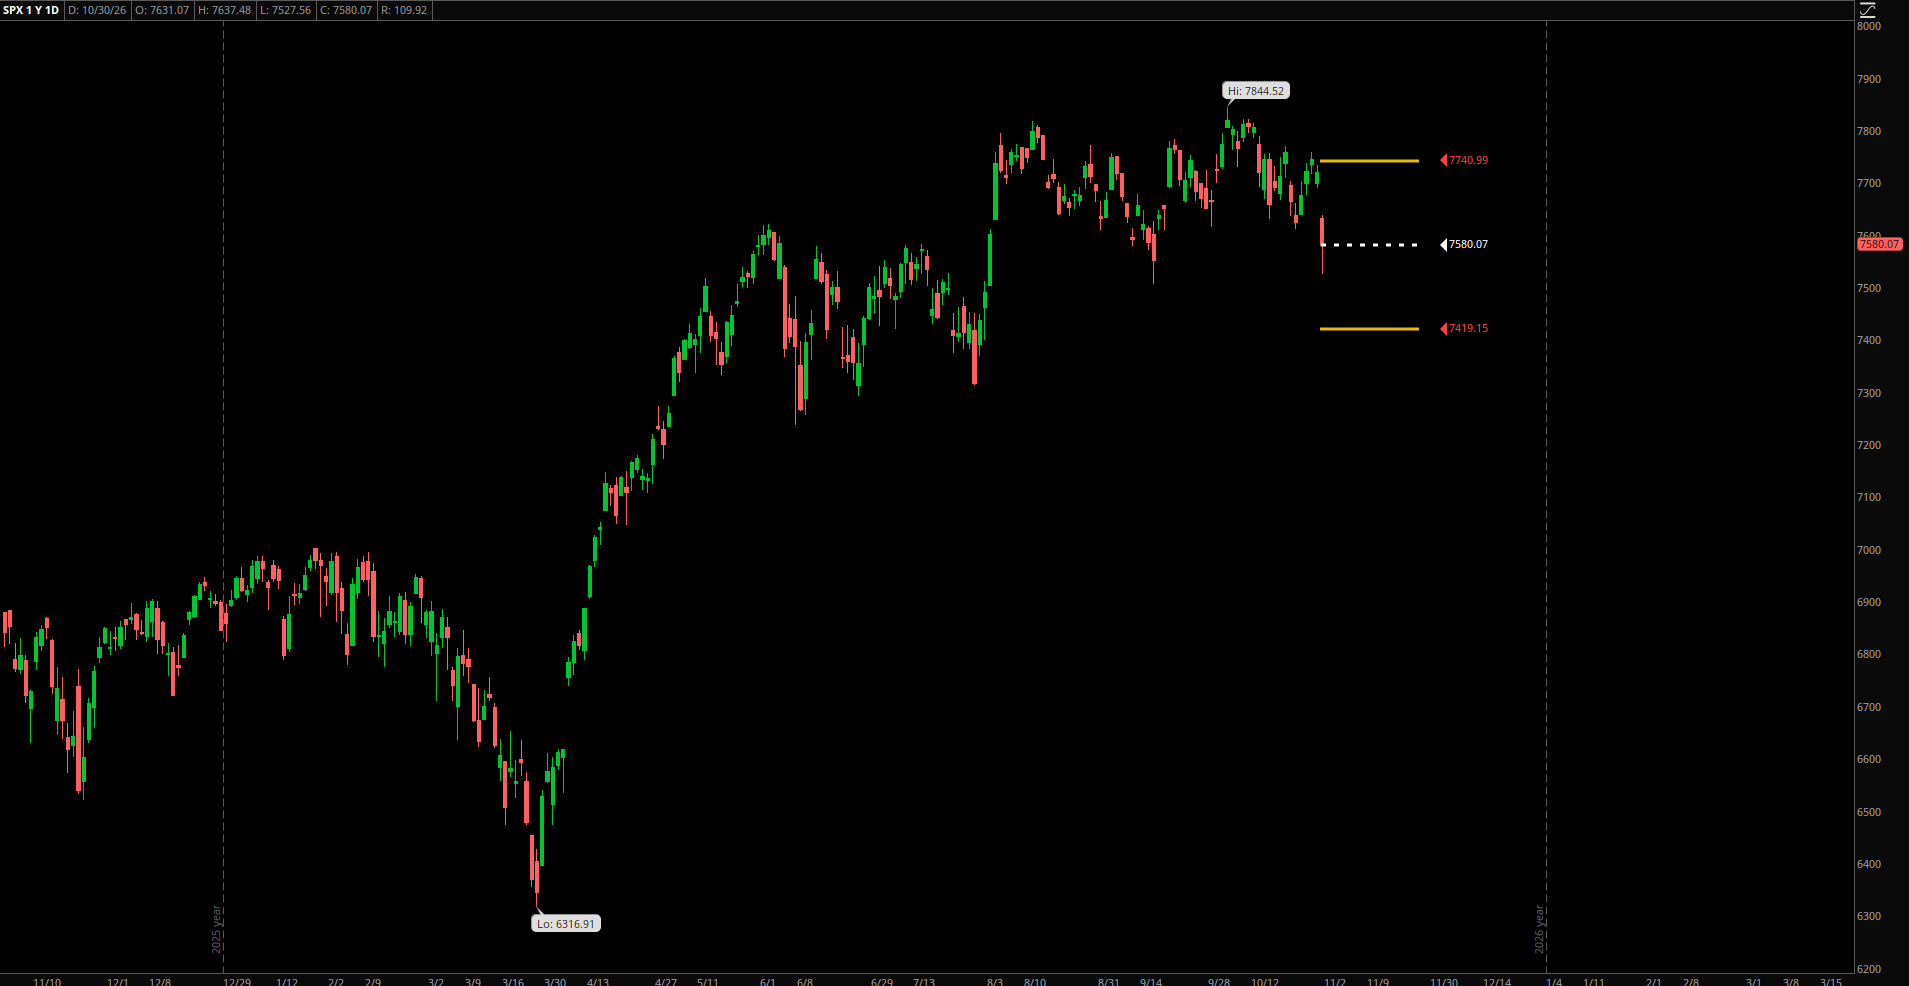
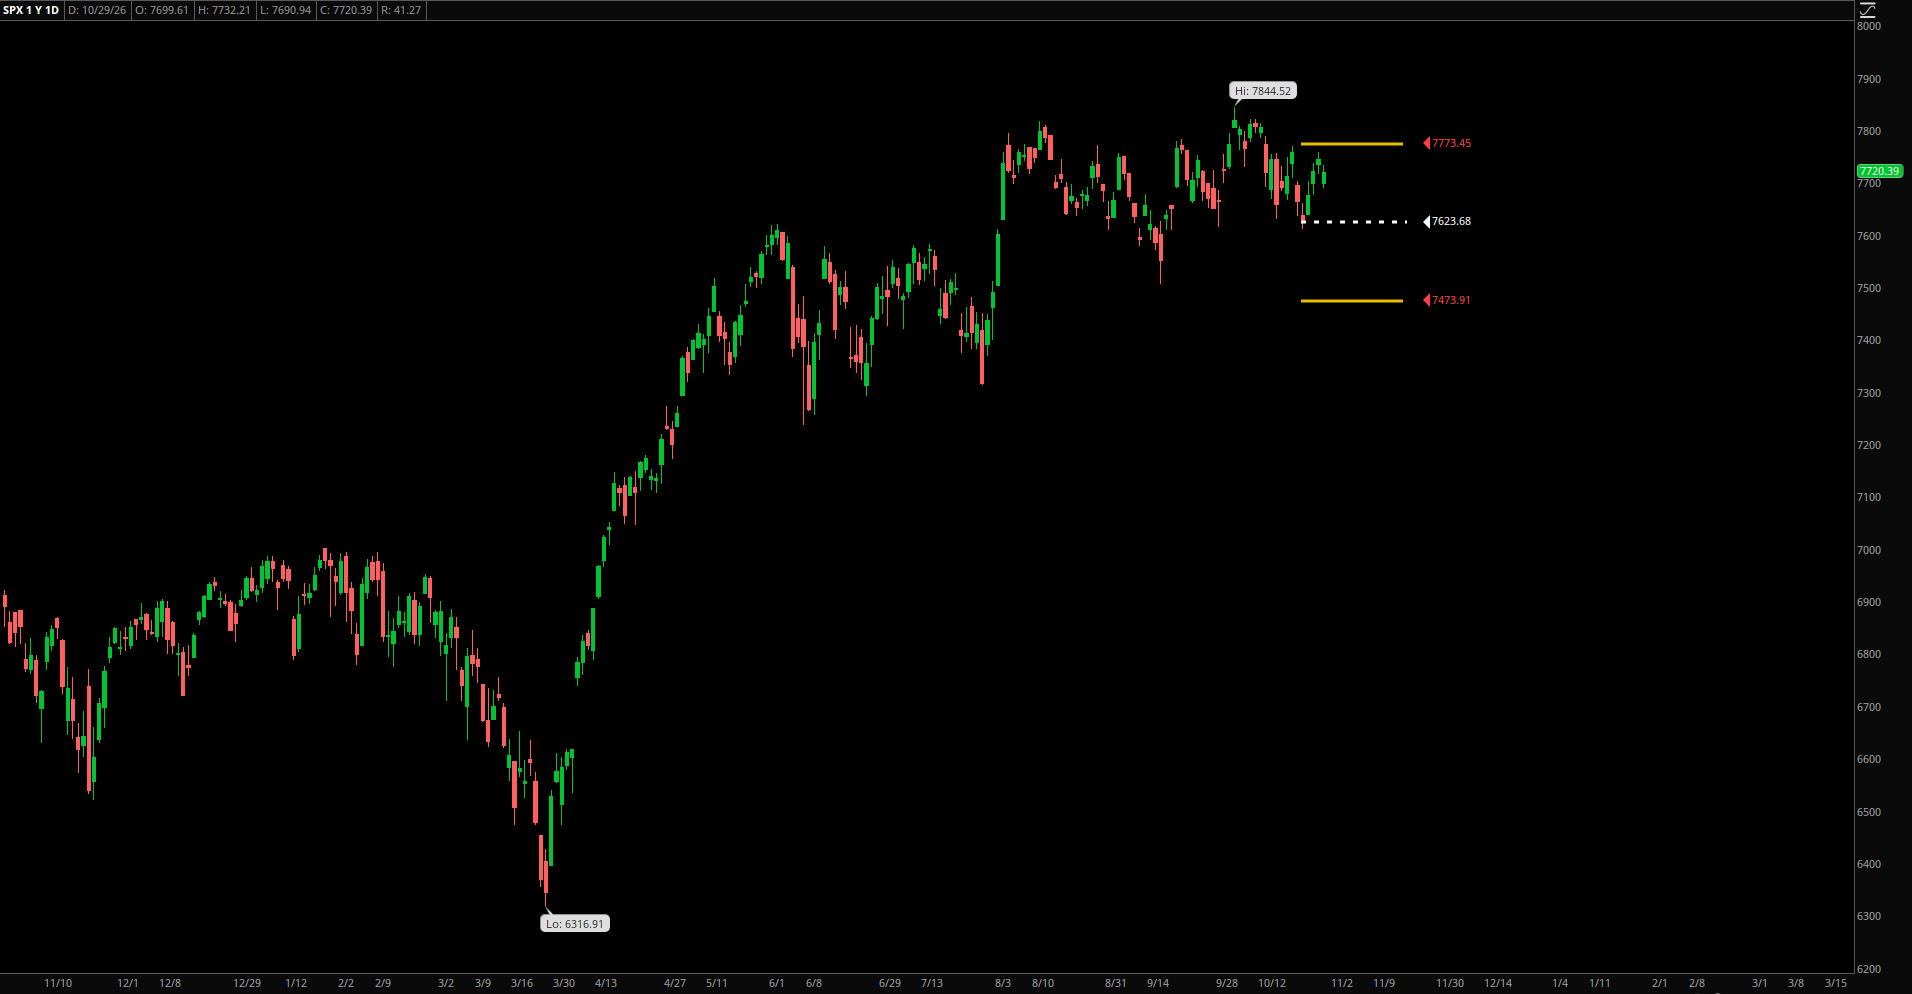
We spent a better part of 2 days this week outside of the expected move but eventually recovered back inside. As was mentioned in the post yesterday, the highest probability outcome was that SPX went back over 5900. We closed the week at 5954.
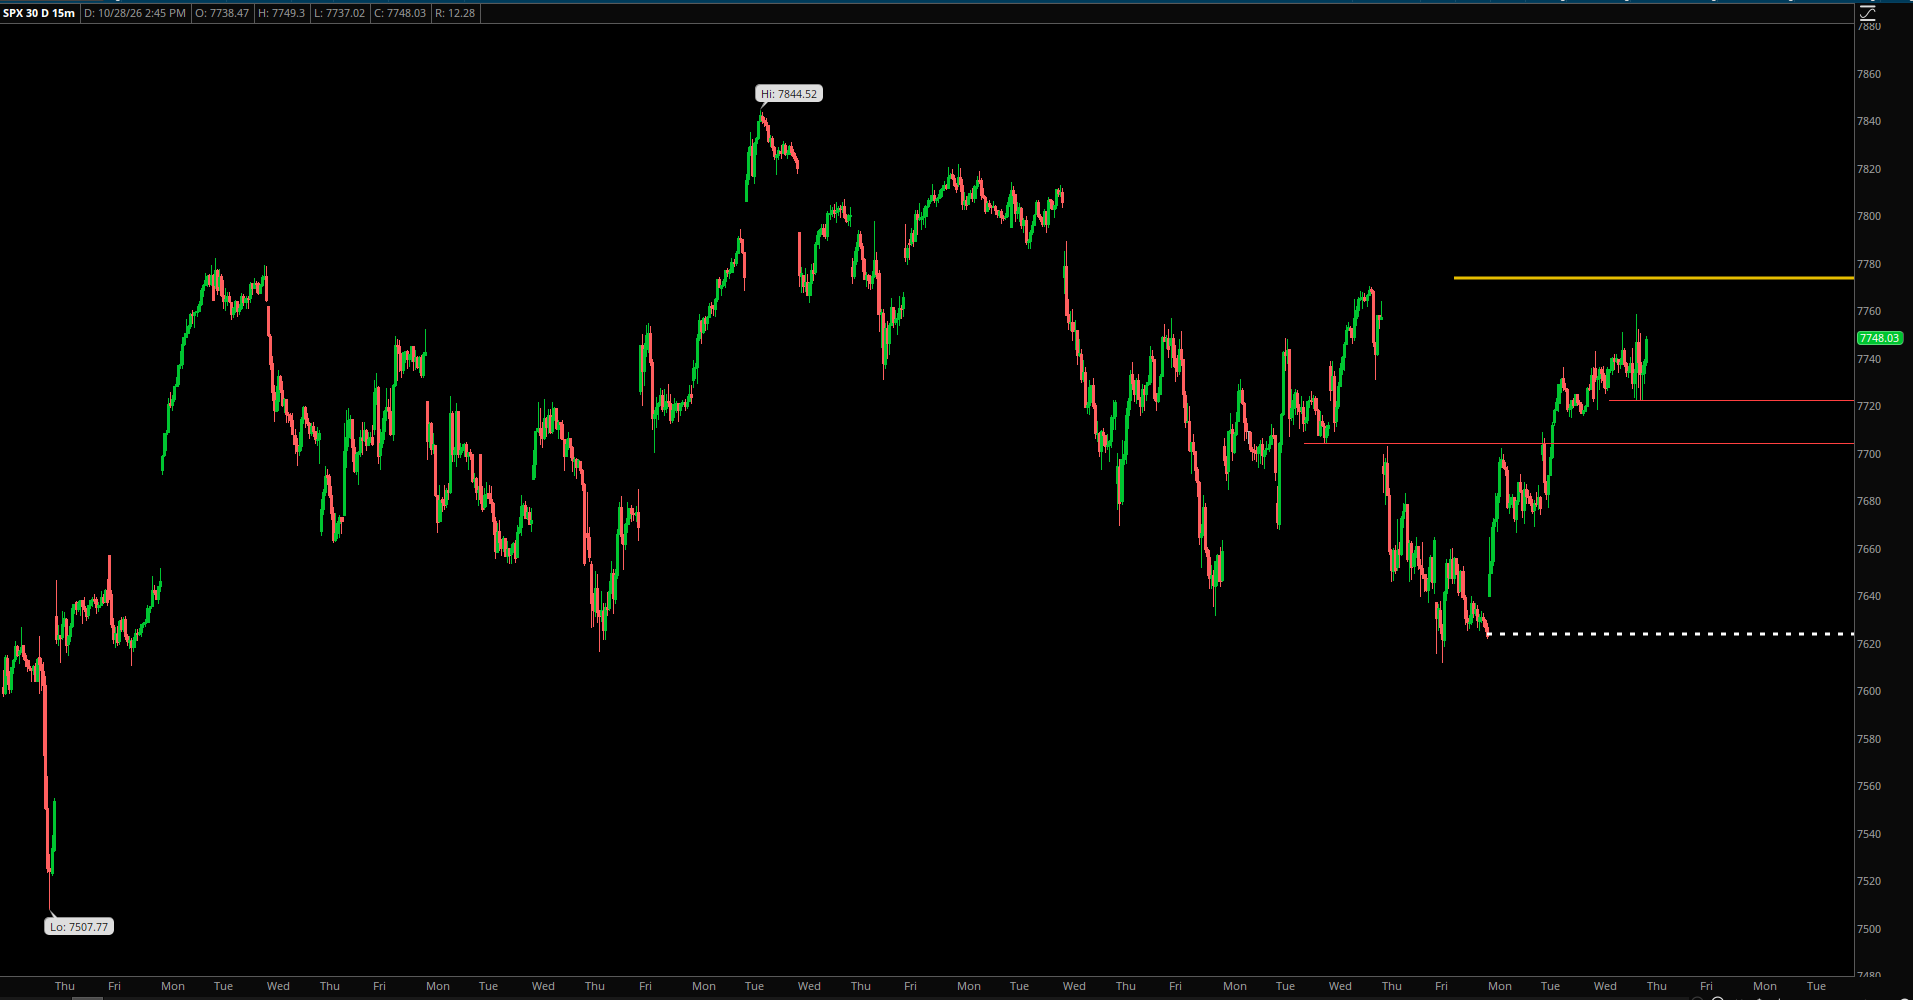
The 15-minute chart shows the move in a little bit more detail. The recovery is very steep, and the momentum is certainly there. We also broke back into a very heavy supply zone from Wednesday and Thursday. We can see price action being very choppy and sideways in this area prior to the drop late Thursday and early today.

For the upside momentum to continue, the very first level for SPX is to break out of this new grey box, for which the upper end is around 5970. If 5970 is to be broken, there is a high probability that 6000 is next target. We know 6000 is an important number and it will be critical to see how price action behaves if we get there.
NVDA also showed a similar recovery today after falling down all the way to 116. In the update yesterday, it was mentioned that if 120 did not hold then 115 would be the next level of support. We got to 116 and bounced all the way back, closing the day above 125.

NVDA could be picking up some steam ahead, but first it must retake 130.
TSLA also showed possible signs of reversing today. We made a new low of 273 today, and as we have been seeing from the charts and as mentioned in the update yesterday, 270-271 was the next level to watch for.

While I have been extremely bearish on TSLA, I do think that it is oversold in the short term and should see a bounce. My outlook on TSLA remains very bearish for the long term, but I could see a retest of 317 or even higher in the coming days if the entire market rallies.
As for GOOGL, yesterday’s post mentioned 164-166 as the target range. We just about got down there today with the low being 166.77. GOOGL also rallied back and closed above 170.

Similar to TSLA and NVDA, I think GOOGL is also due for a bounce and the first target to watch for is 175.
Moving onto AAPL, the update yesterday mentioned that 230 was the next level down on AAPL and the expectation was that it should hold. The low today on AAPL was 230.20 and it closed at almost 242. That is a pretty significant hold of a key level and a pretty sharp recovery.

Should AAPL continue to rally, I think it is a pretty clear path to 250.
Overall, the market behaved as expected coming into today. All the key stocks we watch followed their expected levels and reversed at zones where there was a high probability of reversing from.
Sometimes the market tells us exactly what it wants to do and exactly where it is heading. This week was a very textbook example of that. While we did breach the expected move to the downside, which was a surprise, the market snapped back into the expected range.
The lesson for this week is always follow the probabilities. While nothing is 100% probable, the market plays to these probabilities more often than not.
We will explore key targets and levels for next week and more over the weekend.
Stay tuned!
Leave a Reply