The key level on SPX to watch for coming into today was 6000, which we broke and closed below. For the time being, the sentiment and price action is bearish and there is a high probability we head towards 5900, which is also the lower end of the expected range.
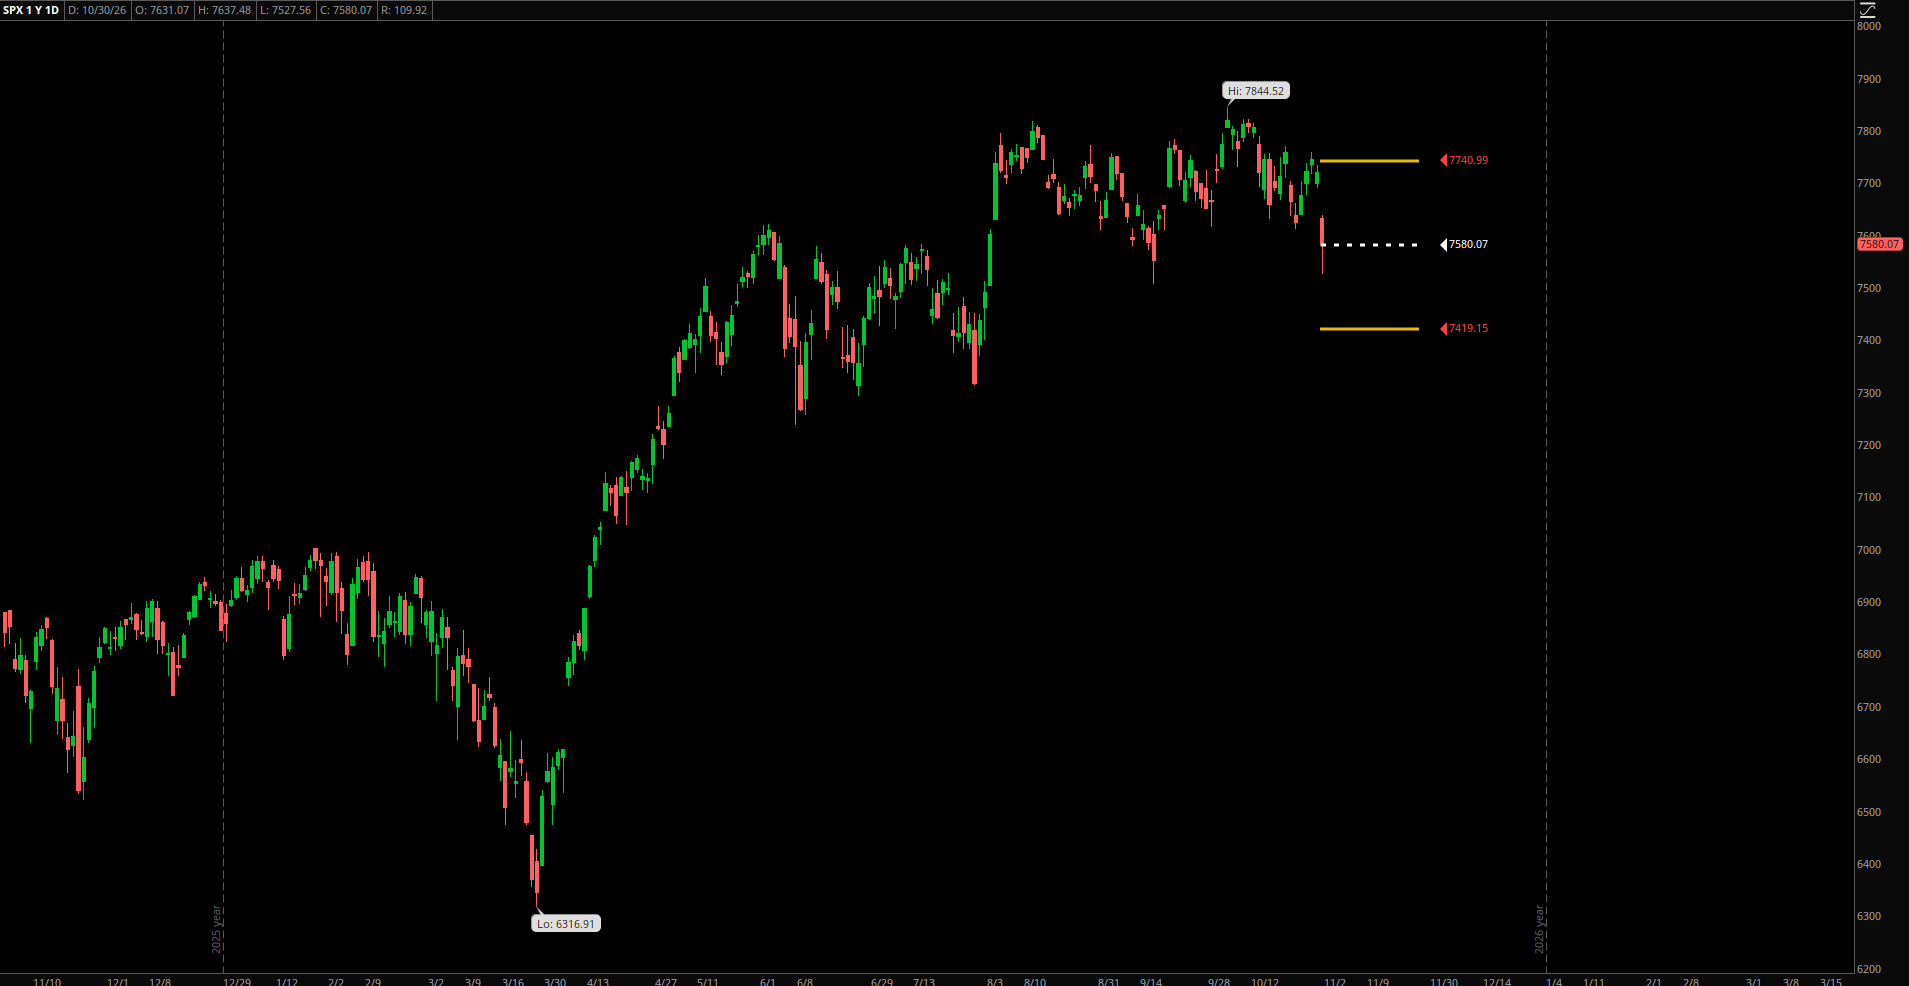
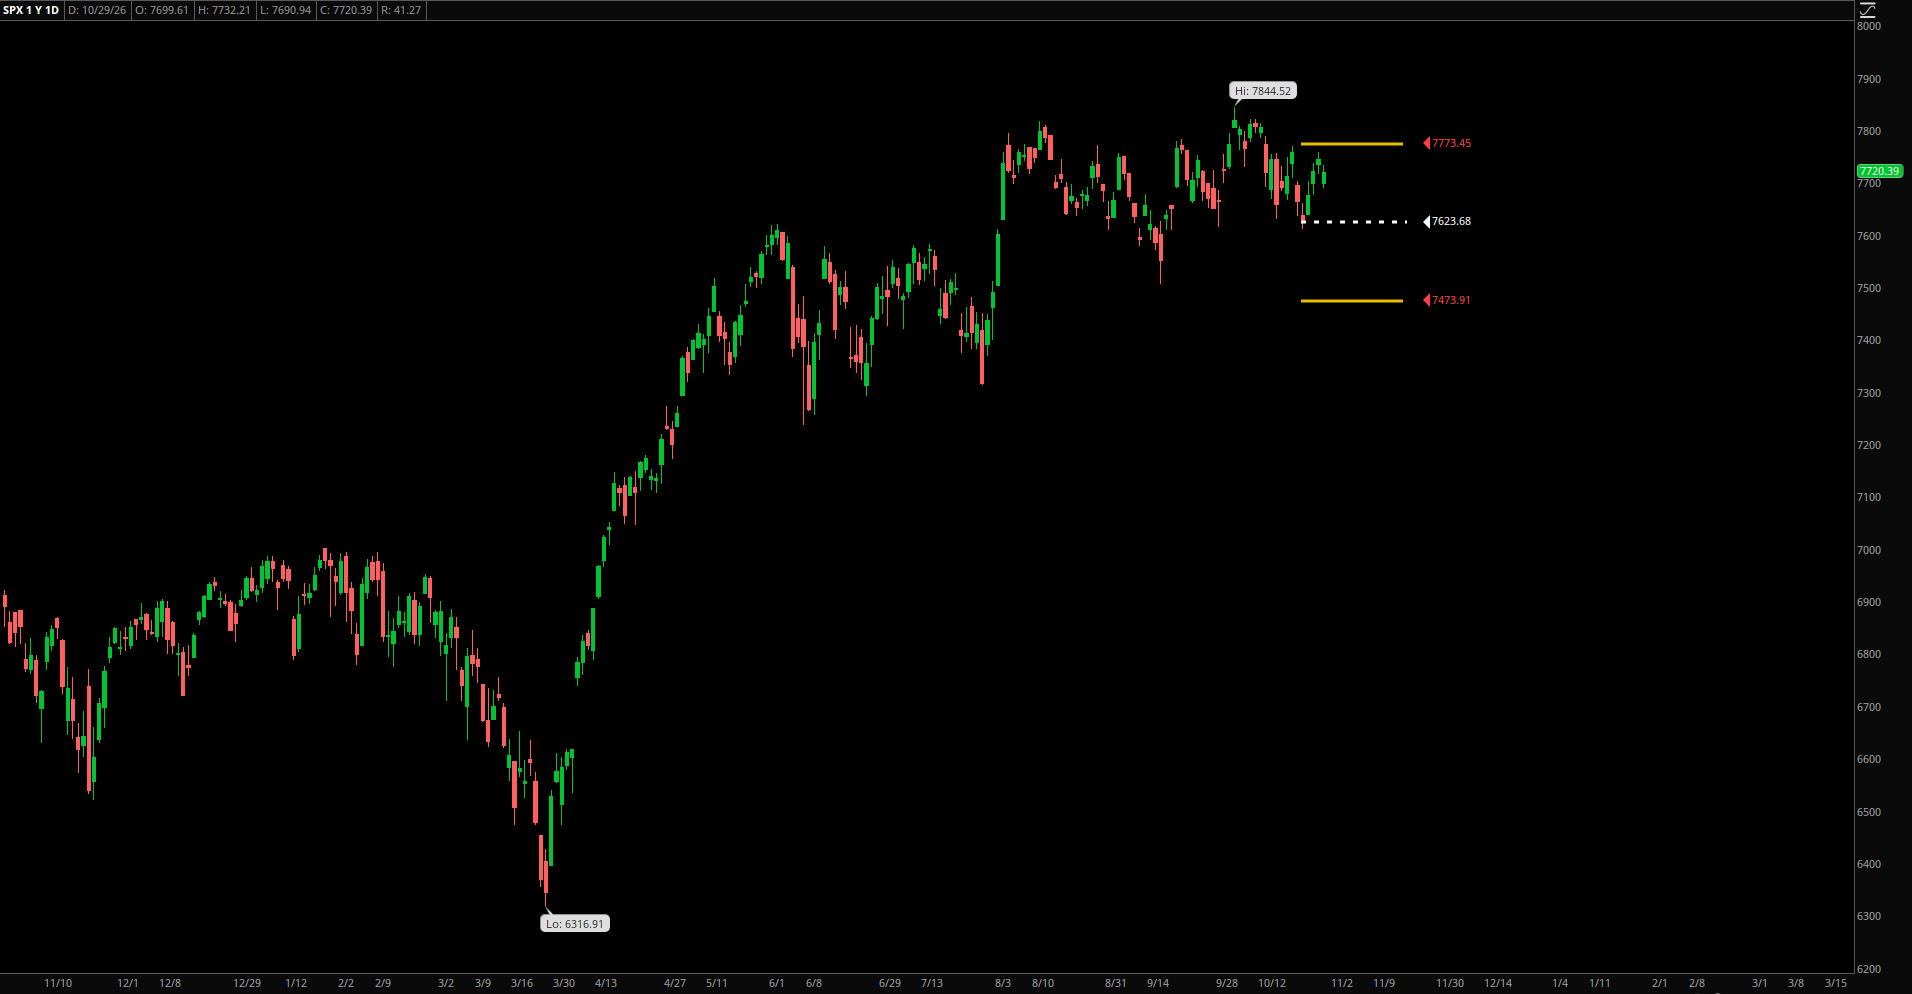
The daily chart on SPX also shows a series of 3 bearish red candles in a row, indicating the strength to the downside. We have been continuously selling off since the highs were made last Wednesday.

SPX is in the lower half of the expected range and is trending down. We are about 83 points away from hitting the lower end.
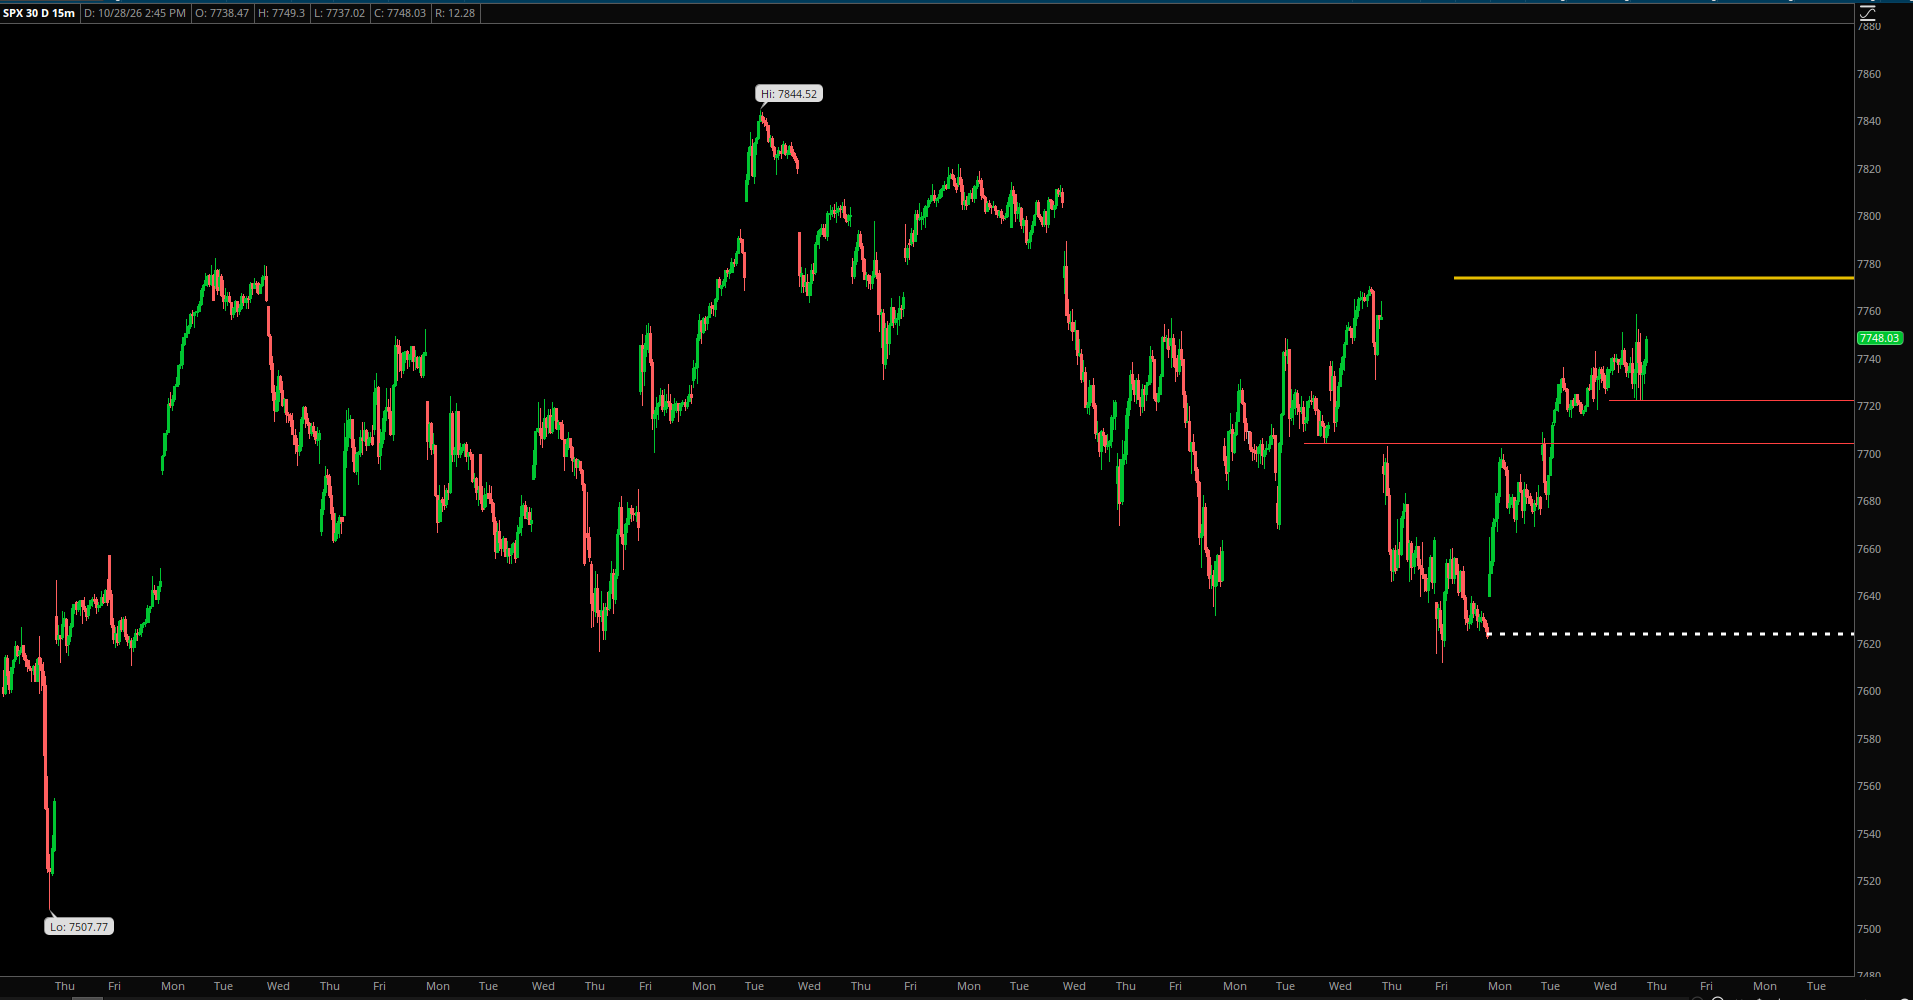
The price action for today was a day where every rally was sold and any up move was unable to sustain any momentum. Looking at the 15-minute chart, we can see that SPX gapped open higher this morning and immediately sold off. We spent most of the day recovering only to sell off again at the end of the day and close near the lows.

We are certainly a long ways away from that high of 6147 last week.
I also want to showcase something interesting on the SPX chart. The last few large down moves we have had (deepseek, tariffs and CPI data), all had a similar pattern. We had a huge gap down on the open and immediately recovered and rallied to new highs.

However, this time we can see that there has been no gap down but instead we have had a pretty orderly selloff / reversal from the top. There was no instant panic down move that quickly got bought up. We are actually seeing some legitimate sell side pressure for the first time in a while.
Is this a sign of things to come?
For now, we will take it day by day and level by level. For tomorrow, there really isn’t much support until the low 5900s and rallying over 6043 is the only way I see a bullish scenario playing out.
As for NVDA, we know it has earnings this week and we barely held onto 130 today. I mentioned in the last post that 130 needs to be held and the low today was 130.08.

NVDA is on the verge of collapsing back into our lower box which could be extremely bearish. We’re just a couple of days away from earnings so NVDA bulls have to hold the line here or we could be headed lower.
I mentioned last week that AAPL lately seems to do the opposite of what SPX and NDX do. Once again as most of the market sold off, AAPL found strength and continued to rally.

We have confirmation of a break out of the bull flag but are still at a critical resistance point. AAPL breaking 250 to the upside could ignite some momentum.
GOOGL continues to slip away from the key level we have been watching. The price target still remains around 175 and that has not changed. GOOGL is finally starting to head down there, with the low today being around 178.

I think GOOGL still has a little bit more room to go down.
TSLA continues to also fade and made a new low for the current down move. This is as expected and as I have been saying for a while, the target is still in the low 300s.

I think once 317 gets broken, TSLA will get to the low 300s pretty quick.
Overall, the price action and sentiment remains to be bearish and as I highlighted above, this down move looks and feels different. We don’t have a major gap down, the sell off has been very orderly and for the first time in a while, every rally is actually sold or fails to sustain.
Until some of these signs change, the price action and sentiment is bearish. We might be on the verge of being slightly oversold in the short term, but that doesn’t mean much if momentum stays strong to the downside.
For now, every rally should be cautiously sold and the trend should not be fought. Breaking above 6043 could change that but the near term target is 5900.
Good luck!

Leave a Reply