Have you ever wondered why strong market rallies are sometimes followed by swift declines?
Beyond the numbers and charts lies a truth that often goes unnoticed: psychology. In this post, we’ll explore how the emotions of market participants—greed, fear, complacency, and capitulation—not only shape volatility but also set the stage for broader market trends.
The Emotional Drivers of Market Behavior
Greed and Over-Optimism
When the economy is strong or new technologies promise disruptive change, a surge of optimism can quickly spiral into overconfidence. Investors caught in this wave often ignore warning signals in their chase for extraordinary returns.
- The Anatomy of Greed:
- Exuberant Buying: During periods of strong economic performance, capital flows in rapidly. Investors pile into stocks, sometimes pushing prices far above what fundamentals might support.
- Low Volatility Masks Risks: These phases are often characterized by deceptively low volatility—investors are so confident that “this time it’s different” that caution takes a back seat.
- Signal Example: In the late 1990s dot-com era, investors were captivated by the promise of a digital revolution. The euphoria led to massive inflows despite shaky earnings, only to be met with a dramatic reversal when the bubble burst.
- Exuberant Buying: During periods of strong economic performance, capital flows in rapidly. Investors pile into stocks, sometimes pushing prices far above what fundamentals might support.
Fear and Panic Selling
When uncertainty creeps in or negative news begins to accumulate, fear can quickly transform even a rational market into one marked by panic selling.
- The Anatomy of Fear:
- Rapid Reversals: A sudden shift in sentiment can trigger steep sell-offs as investors rush to exit positions before losses mount further.
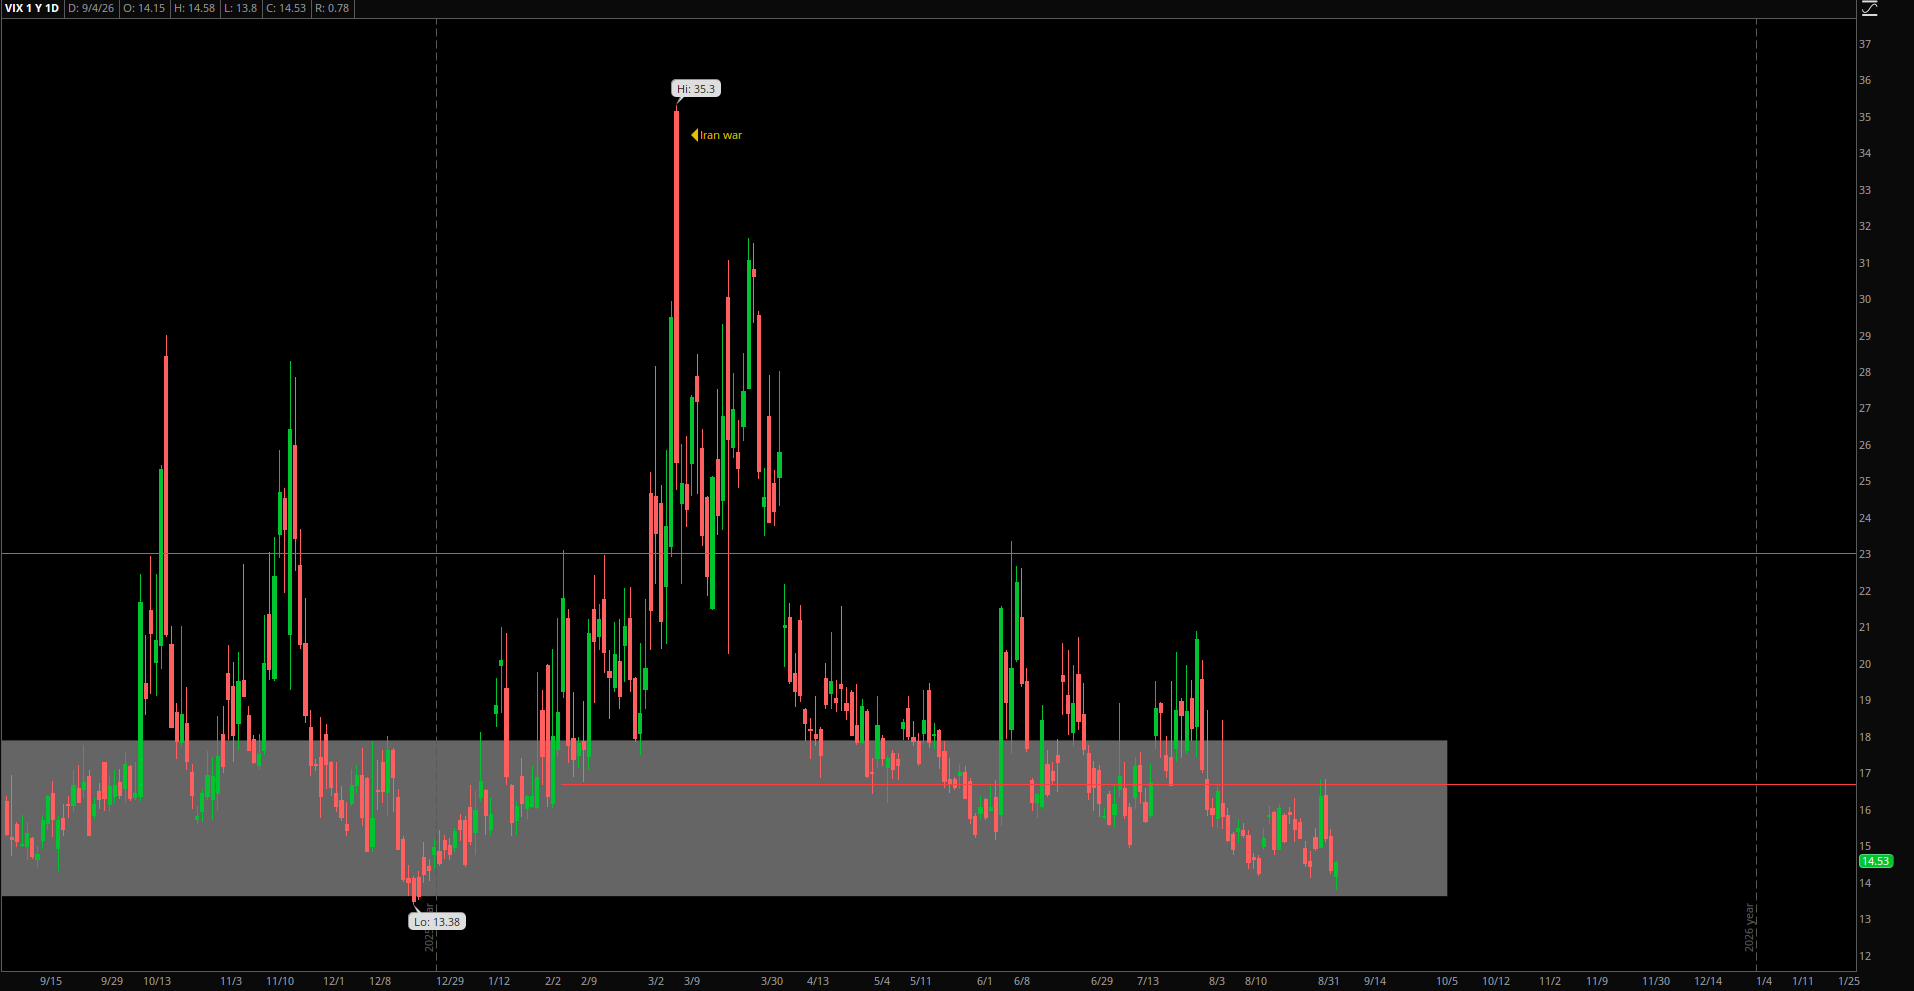
- Volatility Spike: The VIX—often dubbed the “fear gauge”—soars as uncertainty surges, reflecting the rapid pace of selling and mounting risk aversion.
- Signal Example: The 2008 financial crisis is a textbook case where fear replaced optimism almost overnight, leading to dramatic declines and record-high volatility.
- Rapid Reversals: A sudden shift in sentiment can trigger steep sell-offs as investors rush to exit positions before losses mount further.
Complacency, Capitulation, and the Rise of FOMO
Extended periods of low volatility can lull investors into complacency, while rapid swings from euphoria to panic can define market cycles.
- Complacency and the Illusion of Stability:
- False Security: A prolonged bull market with minimal turbulence often leads investors to believe that the upward trend will continue indefinitely. This overconfidence can obscure emerging risks.
- Signal Example: When major indices consistently report record highs with little volatility, it might be a sign that investors are ignoring warning signals, setting the stage for a future correction.
- False Security: A prolonged bull market with minimal turbulence often leads investors to believe that the upward trend will continue indefinitely. This overconfidence can obscure emerging risks.
- Euphoria and FOMO (Fear of Missing Out):
- Euphoria: As bull markets extend, optimism can morph into euphoria. Investors begin to invest irrationally, chasing ever-higher returns without a thorough look at valuations.
- FOMO: The fear of missing out drives even cautious investors into buying overhyped stocks. Media hype, social media buzz, and relentless bullish commentary can create an environment where valuations soar far beyond rational limits.
- Signals of Euphoria and FOMO:
- Overextended Valuations: Price-to-earnings ratios and other metrics may skyrocket, far above historical norms.
- Surge in Retail Participation: A noticeable increase in trading volumes—often driven by retail investors influenced by online chatter—can be a strong signal of FOMO.
- High Margin Debt Levels: Excessive borrowing to invest indicates that investors are willing to take on outsized risk in the chase for returns.
- Overextended Valuations: Price-to-earnings ratios and other metrics may skyrocket, far above historical norms.
- Historical Example: Many past bull markets have witnessed a phase of near-universal “buy” sentiment that eventually leads to a sharp reversal—think of the tech bubble’s collapse in the early 2000s.
- Euphoria: As bull markets extend, optimism can morph into euphoria. Investors begin to invest irrationally, chasing ever-higher returns without a thorough look at valuations.
- Capitulation:
- Definition: Capitulation represents the extreme end of panic selling, where investors abandon positions at almost any price.
- Signal Example: Sudden, dramatic spikes in trading volumes combined with plunging prices and a surge in volatility can indicate that capitulation is underway. While it often marks the nadir of a downturn, the recovery does not follow immediately but is set in motion as selling pressure exhausts itself.
- Definition: Capitulation represents the extreme end of panic selling, where investors abandon positions at almost any price.
Beyond Charts and Financials: The Limits of Technical and Fundamental Analysis
The Subjectivity of Technical Analysis
Technical analysis relies on interpreting chart patterns, trends, and various indicators. However, the human element in this process can introduce bias.
- Seeing What You Want to See:
- Subjective Interpretations: Patterns like head-and-shoulders, triangles, or support and resistance levels can be open to interpretation. Analysts may interpret these patterns in ways that confirm their pre-existing beliefs rather than providing objective signals.
- Confirmation Bias: In times of market euphoria, technical analysts might downplay warning signals, while during panic, they may overemphasize negatives—both scenarios leading to a distorted view of market reality.
- Subjective Interpretations: Patterns like head-and-shoulders, triangles, or support and resistance levels can be open to interpretation. Analysts may interpret these patterns in ways that confirm their pre-existing beliefs rather than providing objective signals.
The Incompleteness of Fundamental Analysis
Fundamental analysis examines financial statements, earnings, growth potential, and competitive position. Yet, even robust fundamentals sometimes fail to push a stock higher if market sentiment is against it.
- The Case of “Stagnant” Stocks:
- Examples: Companies such as Verizon, Walmart, and McDonald’s consistently post strong profits and growth. However, their stock prices often remain flat.
- Psychological Disconnect: Despite strong financials, these companies can be perceived as “boring” or lacking in exciting growth opportunities. The collective mood can drive capital away from these solid performers toward flashier, riskier prospects.
- Examples: Companies such as Verizon, Walmart, and McDonald’s consistently post strong profits and growth. However, their stock prices often remain flat.
The Power of Psychological Analysis
While technical and fundamental analyses provide important insights, they sometimes miss the broader emotional currents that ultimately move the market.
- Sentiment as a Leading Indicator:
- Extreme Optimism or Pessimism: When surveys or social media analytics show that nearly every investor is either overly bullish or deeply bearish, it’s often a precursor to market reversals.
- Behavioral Finance Insights: Research has shown that cognitive biases such as overconfidence, herd behavior, and loss aversion have a profound impact on market dynamics.
- Psychological Analysis in Practice: Tracking investor sentiment through social media, sentiment surveys, and media tone analysis can provide early warnings of market extremes that traditional methods may overlook.
- Extreme Optimism or Pessimism: When surveys or social media analytics show that nearly every investor is either overly bullish or deeply bearish, it’s often a precursor to market reversals.
The Power of Psychological Analysis in Practice
Investor psychology is a formidable force that can sometimes predict market movements even before technical indicators or financial reports catch up. Let’s explore how this works:
- Sentiment as a Precursor to Movement:
When investor sentiment reaches extreme levels—either bullish or bearish—it can act as an early warning signal. Extreme bullishness, for example, might indicate that the market is overheated, while widespread pessimism might suggest a potential bottom. - Real-Time Applications:
Consider the case of well-known stocks:
- NVDA: Recently, NVIDIA has experienced swings of 20-30% over the course of weeks. These dramatic moves are often driven by the excitement and subsequent fear of missing out on the next technological breakthrough. Investors pile in during the euphoria, and as soon as a hint of risk appears, rapid profit-taking ensues.
- META: Despite strong underlying metrics, Meta has at times been driven to bubble-like levels by sheer exuberance. Investors’ blind pursuit of the “next big thing” can inflate prices to unsustainable levels, only for sentiment to reverse rapidly.
- TSLA: Tesla’s price action is closely tied to the persona of its CEO, Elon Musk. The narrative around TSLA—whether driven by bold promises or controversial statements—often overrides quarterly fundamentals, leading to significant volatility as investor perception shifts.
- NVDA: Recently, NVIDIA has experienced swings of 20-30% over the course of weeks. These dramatic moves are often driven by the excitement and subsequent fear of missing out on the next technological breakthrough. Investors pile in during the euphoria, and as soon as a hint of risk appears, rapid profit-taking ensues.
By incorporating these psychological factors into their analysis, investors and day traders can gain a more holistic view of market trends—one that recognizes the power of human emotion in driving market movements.
Psychology in Action: How Emotion Drives Market Trends
Investor sentiment is not a static metric; it actively shapes market behavior, especially in environments dominated by rapid rotation and short-term speculation.
- Rapid Rotation and FOMO:
In both day trading and longer-term speculation, stocks can shift from being hot favorites to falling out of favor almost overnight. This rotation is often driven by FOMO—investors rush into stocks perceived as the “next big thing” without thoroughly evaluating the risks.
- Example: When a particular stock or sector becomes the center of social media buzz or is touted as a must-own by influential figures, prices can skyrocket. However, if a slight change in sentiment occurs—perhaps due to disappointing news or simply the realization that the gains are unsustainable—investors can quickly exit, leading to steep declines and high volatility.
- Example: When a particular stock or sector becomes the center of social media buzz or is touted as a must-own by influential figures, prices can skyrocket. However, if a slight change in sentiment occurs—perhaps due to disappointing news or simply the realization that the gains are unsustainable—investors can quickly exit, leading to steep declines and high volatility.
- Sector and Stock-Specific Patterns:
- NVDA’s Rollercoaster: The 20-30% swings in NVDA highlight how momentum fueled by market sentiment can create a rollercoaster effect. Technical charts may briefly signal overbought conditions, but it’s the collective emotional reaction that often drives the next move.
- META’s Bubble Dynamics: As META has approached bubble territory, it has shown how a stock can be propelled by a mix of genuine growth and speculative frenzy. The interplay between rational analysis and the exuberance of FOMO creates a fragile balance that can tip rapidly.
- TSLA and Narrative-Driven Volatility: Tesla’s market behavior is deeply intertwined with the narrative surrounding its CEO. Shifts in public perception—whether due to bold announcements or controversial behavior—can lead to dramatic price swings, independent of the company’s underlying fundamentals.
- NVDA’s Rollercoaster: The 20-30% swings in NVDA highlight how momentum fueled by market sentiment can create a rollercoaster effect. Technical charts may briefly signal overbought conditions, but it’s the collective emotional reaction that often drives the next move.
- Market Rotation Patterns:
Investor psychology often fuels a continuous rotation between stocks and sectors. When a particular asset class becomes overhyped, the allure quickly fades as investors scramble for the “next big thing.” This dynamic is evident in both the intraday swings of day trading and the longer-term cycles seen in broader markets.
By understanding these behavioral patterns, market participants can better anticipate when a trend is driven more by sentiment than by fundamentals—an insight that can provide a critical edge in navigating volatile markets.
What Phase Is the Market in Today?
Answering this question is challenging, as market phases evolve continuously and can differ across sectors and asset classes. However, several key signals can help gauge the current mood:
- Investor Sentiment Surveys:
Recent surveys indicate that investor confidence remains high, with many expressing strong bullish expectations. Extreme optimism often hints at underlying complacency. - Valuation Metrics:
Across various sectors, valuations are reaching or exceeding historical highs—even for companies with stable earnings. This suggests that investors, driven by FOMO, are chasing high-growth narratives even when fundamentals don’t entirely support the exuberance. - Retail Participation and Media Hype:
Increased activity from retail investors, amplified by social media chatter and heightened media coverage of “hot” stocks, points toward an environment where FOMO is a key driver. - Volatility Levels:
Despite relatively low measured volatility—a sign typically associated with complacency—the disconnect between calm market conditions and soaring valuations can be a red flag. History has shown that when low volatility masks overexuberance, a market correction might be on the horizon.
Assessment:
Given these indicators, it appears that the market today is in a phase of cautious euphoria. While optimism and confidence continue to drive upward trends, there are signs—such as overextended valuations and heightened retail enthusiasm—that the environment may be primed for a rotation or even a correction. Investors should remain vigilant, recognizing that market psychology can shift quickly, and balancing their strategies with robust risk management is essential.
Conclusion: Embracing the Psychological Dimension
Market trends are not merely the result of economic fundamentals or technical indicators—they are also deeply rooted in human psychology. Greed, fear, complacency, capitulation, and FOMO are more than just buzzwords; they are measurable, observable phenomena that drive the ebb and flow of the market.
While technical analysis and fundamental analysis offer crucial insights, they can sometimes miss the emotional undercurrents that truly move the market. The study of market psychology provides a powerful alternative lens—one that can explain why robust companies might see stagnant stock prices and why market trends often defy pure rationality.
By understanding these psychological factors and paying close attention to the signs of FOMO and euphoria, investors can better anticipate turning points, manage risk, and even spot opportunities that others might overlook. As you navigate your own investment journey, remember that behind every chart and financial statement lies the collective mood of investors—a dynamic force that often holds the key to market trends.

Leave a Reply