SPX continued to rally to the key levels I spoke about in yesterday’s update. As was mentioned in the post yesterday, I spoke about 6042 being a key level if we broke over 6000. 6042 was the close for last week and the mid-point for the expected range for this week.
What was the high for the day on SPX? That’s right, 6042. We pulled back from that area a few times so that area has proven to be a key resistance level in the current trend.

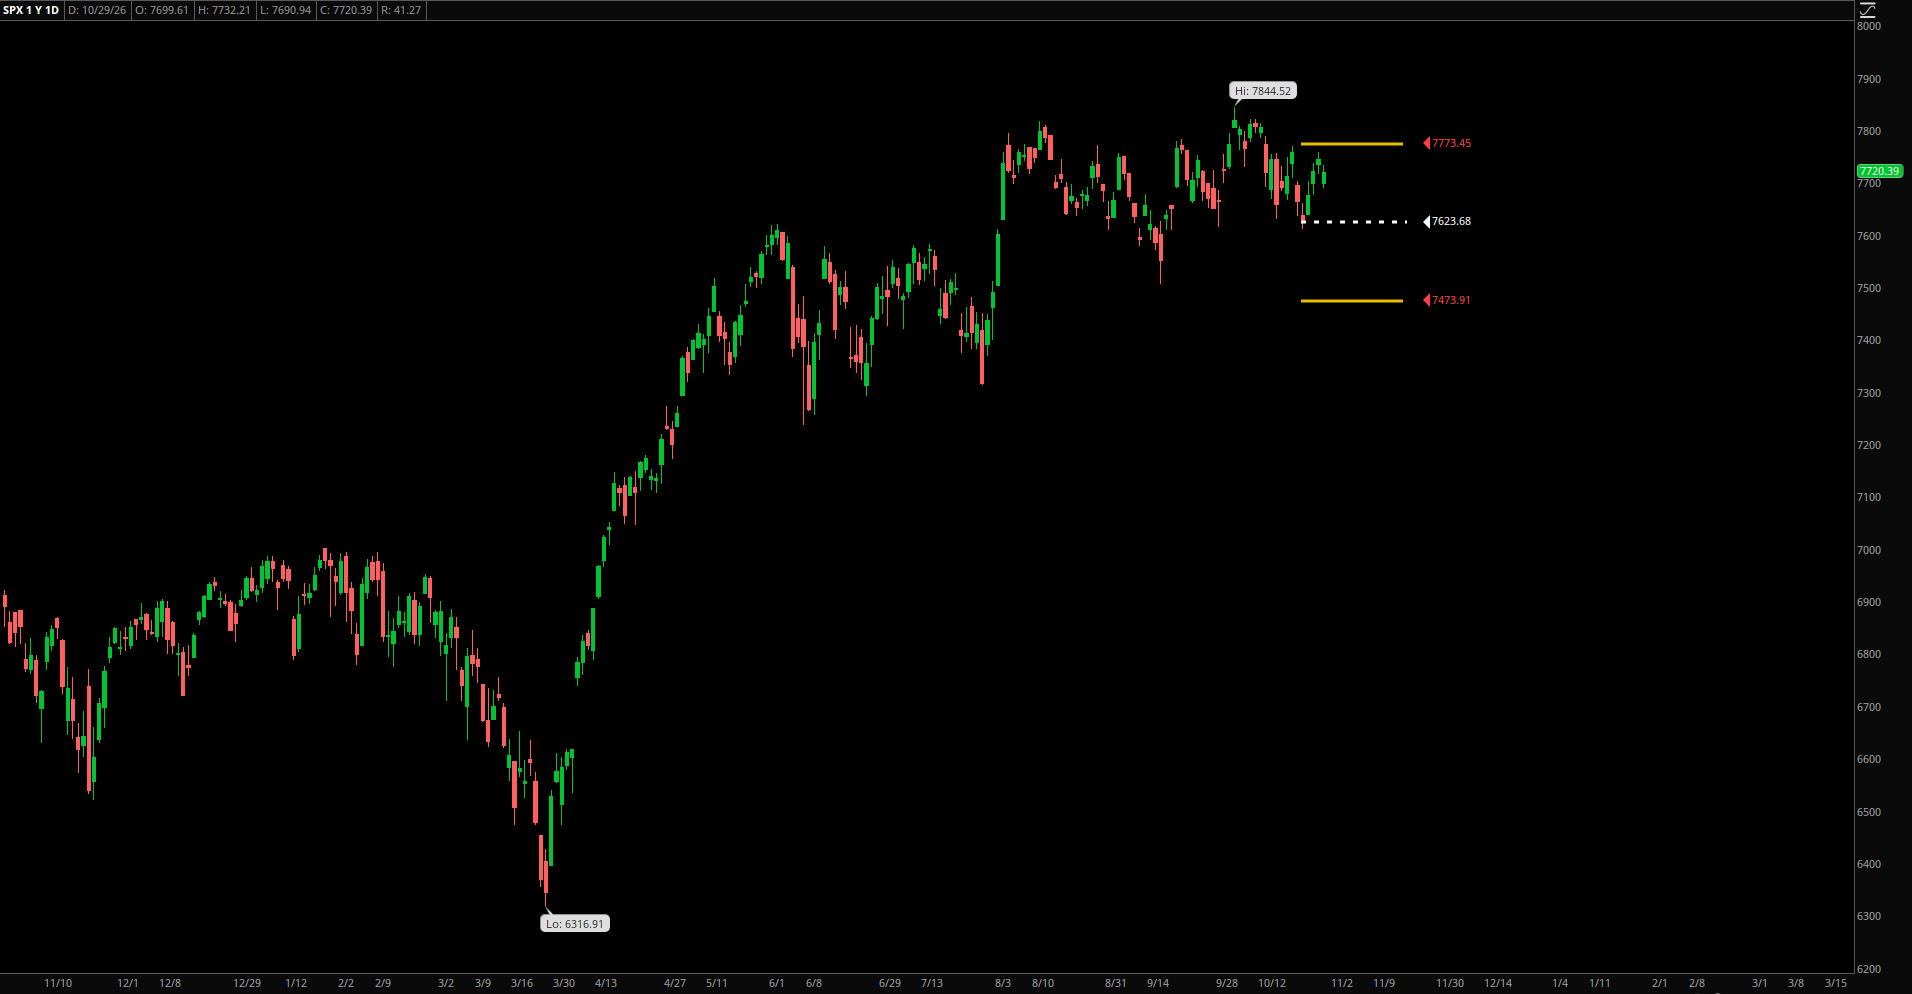
Our usual daily chart shows that we are now unchanged for the week, also signifying that we are at a critical point in the market. If we break over 6042 with some momentum, I expect 6100 or even possibly the all-time highs to be tested.
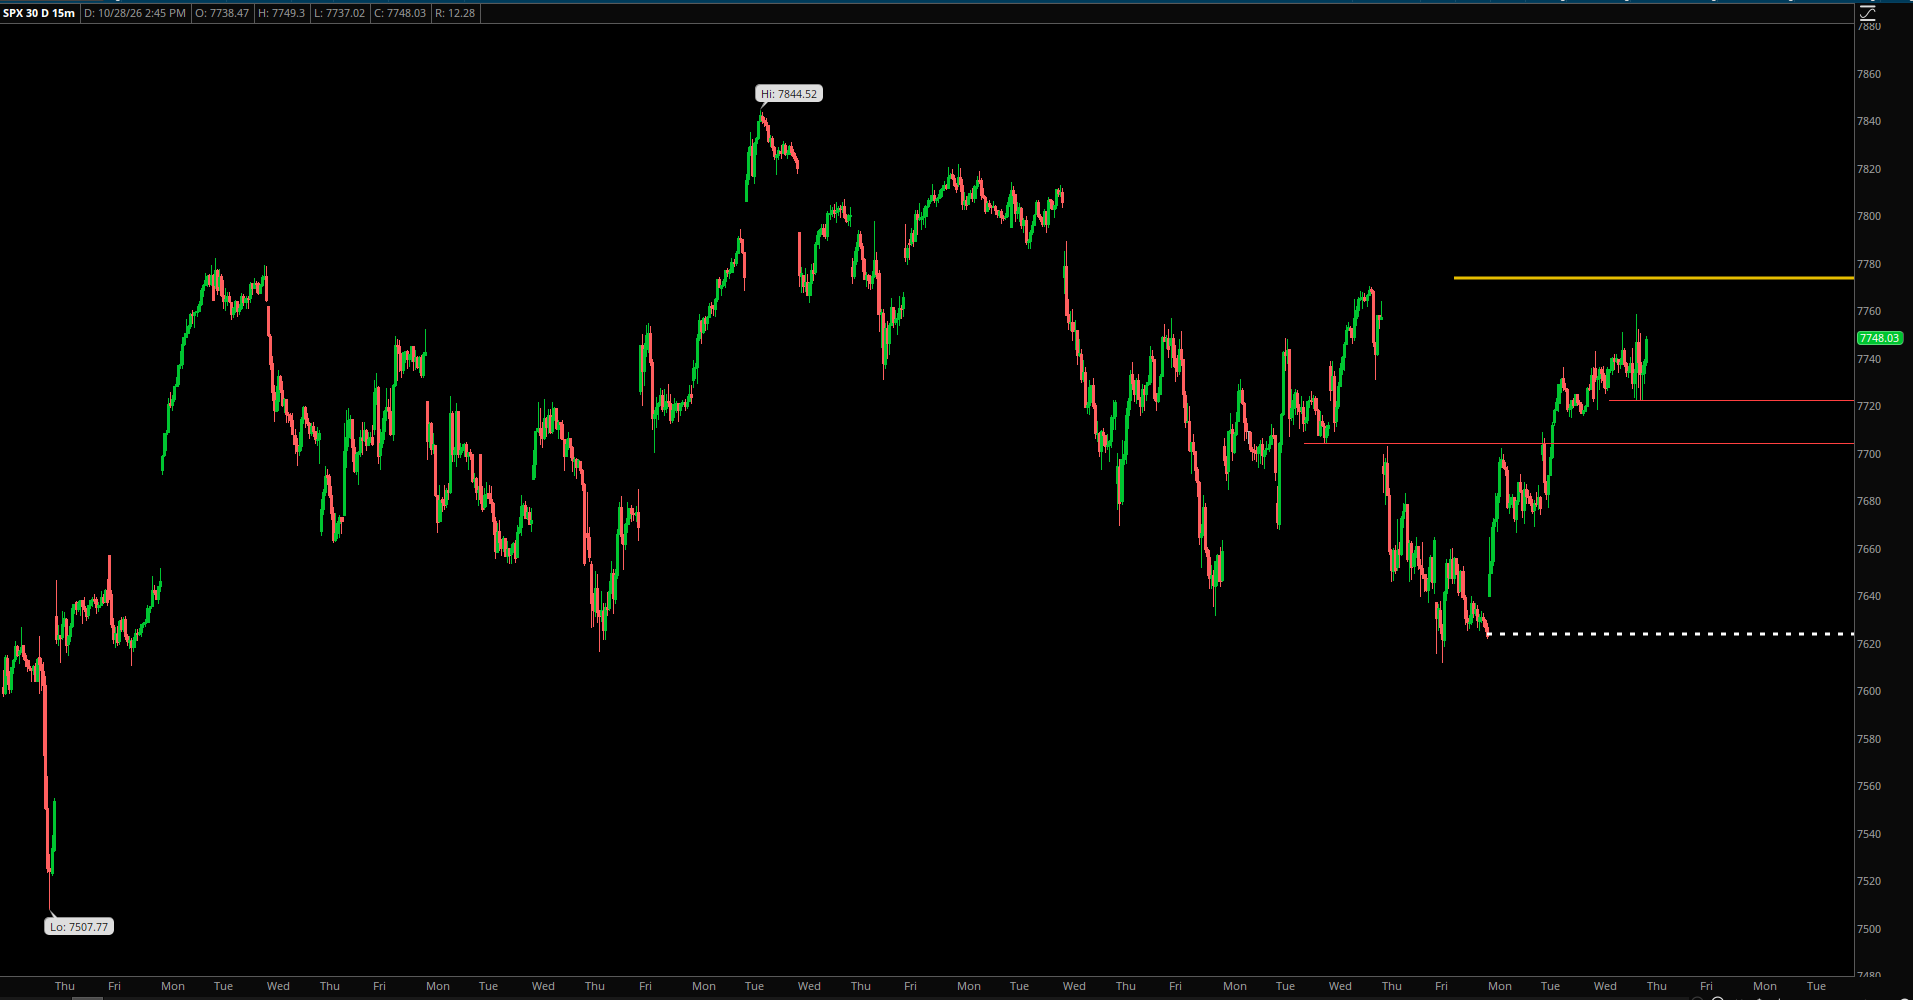
Zooming into the 5-minute chart we have been tracking for a few days now; we can see the collapse from Friday and Monday has been mostly recovered. We are now unchanged for the week.

As mentioned, breaking above the white dotted line with momentum leaves very little resistance from that point to the all-time highs.
NVDA continues to show weakness despite rallying today. It seems like we have a new gray box/range forming on NVDA between 115-130. We are definitely in the lower half of that zone currently.

I’ve zoomed in from the typical chart we usually see to showcase the new zone we seem to be stuck in for the last week or so. Yesterday we briefly gapped down below it but have spent nearly 2 full trading session slowly crawling back. There is not a lot of momentum though, so it still has me cautious on NVDA.
The mid-point there is 123, so I would like to see that break first before I get some bullish optimism back.
We haven’t talked about AAPL much over the last few days, but the head and shoulders pattern I pointed out last week seems to be playing out in a textbook manner.

We can now confirm that the right shoulder is mostly formed, right around the 61.8% fib retracement of the previous down move, and we have continued down since then. While today saw a recovery, I am not optimistic on AAPL with the current price action. If we break back over 240, then the discussion about a failed head and shoulders pattern could be possible. However, for now the trend is down and we may break below 220 if it holds.
GOOGL hit new all-time highs today, but after hours it is down pretty big on missed earnings. This could be another stock with a mass exodus like we saw in NVDA, MSFT and AAPL last week. The grey box marked in the chart is the expected open for tomorrow based on current after-hours trading.

Weakness in GOOGL could cause /NQ to show some weakness as well, especially with AMD being down too. This weakness could spread into other similar tech stocks, so /NQ price action will be important to watch for tomorrow.

/NQ has been mostly weaker on the recovery from yesterday’s lows as well and we know from the posts last week that /NQ has been weak overall for a while now. /NQ has to take 22100 with some momentum to be a market leader again, and so far, we are not seeing a case for that. AAPL and NVDA will have to lead the way for this to be possible, but as we see from their charts, the probability of that happening is slim at the moment.
As I mentioned yesterday, the current market is sensitive to all sorts of geo-political, economic and earnings-based news. Market technicals and other forms are analysis generally don’t do well with chaotic, sensitive markets. In the current climate, a single tweet can influence the market more than any technical indicator.
The key is to analyze what’s in front of us objectively and instead of trying to use the technical data to predict the market, we should chart out key levels and points of possible friction in the market.
Yesterday I mentioned 6042 being that next key level and this is where we found friction today. In order for the recovery to new highs to continue, this level must break with momentum. As of this post, the futures are trading down so we could open further down from 6042. Of course, anything can change overnight.
If we reject 6042 again and break down, outside of the psychological level of 6000, there really is not much support until the 5960 area. The key is to watch the price action tomorrow and see how the market reacts to these key levels, and then take trades accordingly.
Good luck!


Leave a Reply