I mentioned in yesterday’s update that the bearish case to close out the week could be gaining some momentum, and we saw that play out today. SPX closed negative after coming very close to the all-time highs. This level was rejected, and we saw a very sharp reversal to close out the day.
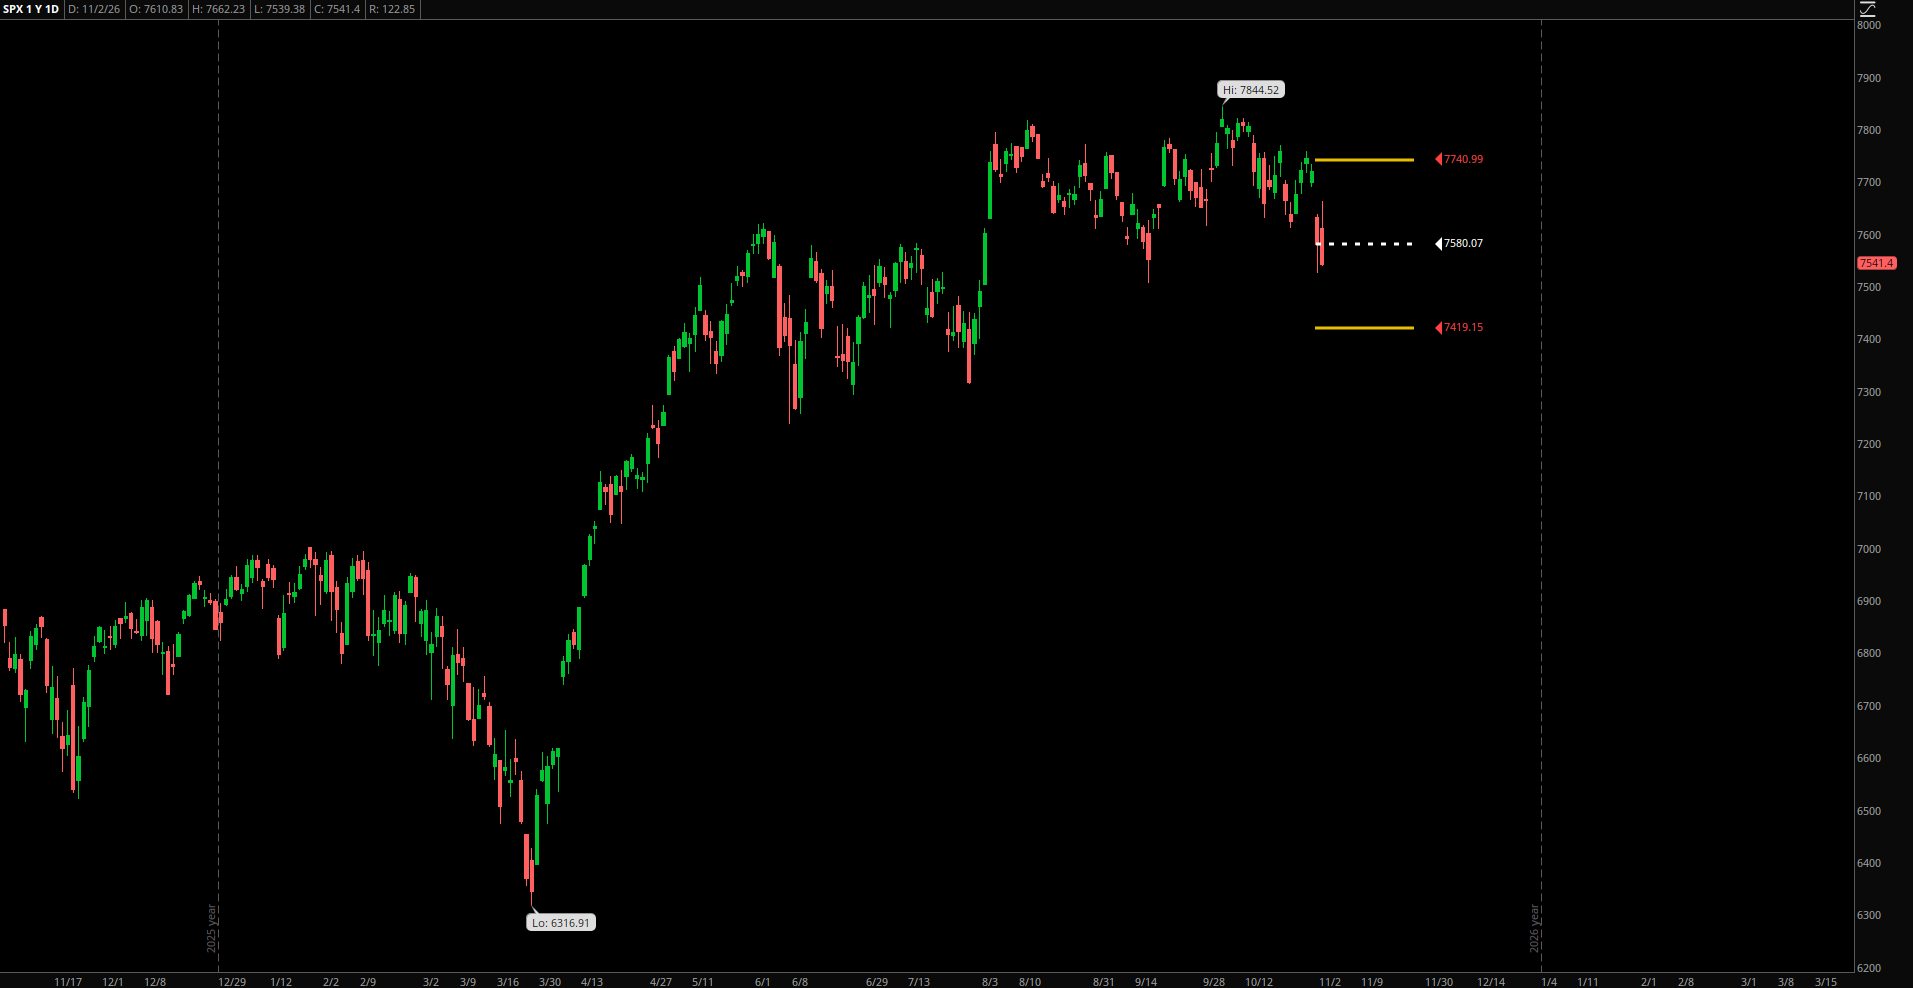
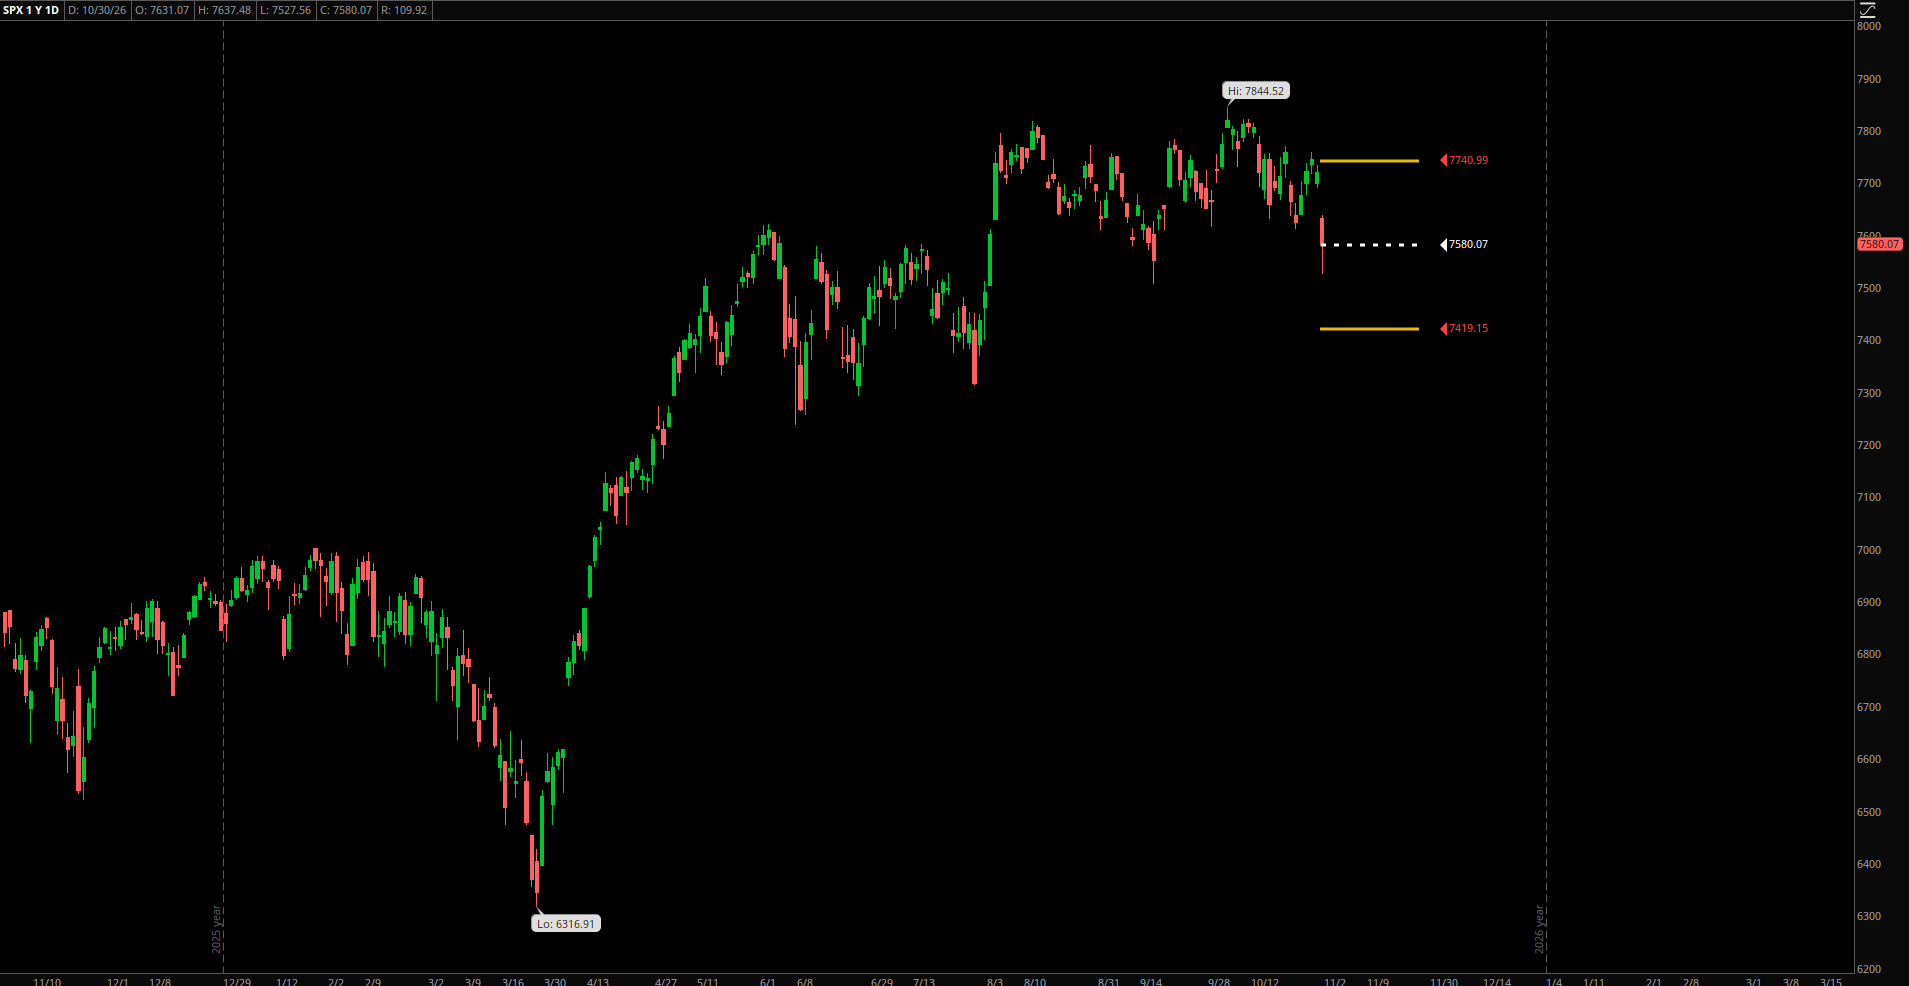
Last Friday we also had a rejection around this level, but the reversal was not that sharp until the following trading session. Today we quickly snapped back and broke below some key support levels as well. As usual, let’s start with the daily chart on SPX. We closed the week almost at the lower end of the expected move, after spending most of the week in the lower portion of the expected range.

The candlestick pattern shows a near perfect bearish engulfing pattern. The market is showing some serious weakness right now and the daily chart certainly reflects that. This week we:
- Spent most of the week in the lower half of the expected range, as well as seeing a breach to the downside. That means there is downside pressure.
- Rejected all-time highs and saw a sharp reversal to close out the week.
- Had good economic data and good earnings reports but saw a market that could not rally or pick up any upside momentum on the good news.
The bearish case continues to grow strong.
We can use the /ES chart to look at some more detail of what happened today. Key levels were rejected, such as the current all-time highs as well as the grey box I have been talking about all week. We did see a push through the box at the open, but that did not last very long. In fact, we came down so fast and so far, we are about 1% away from it again.

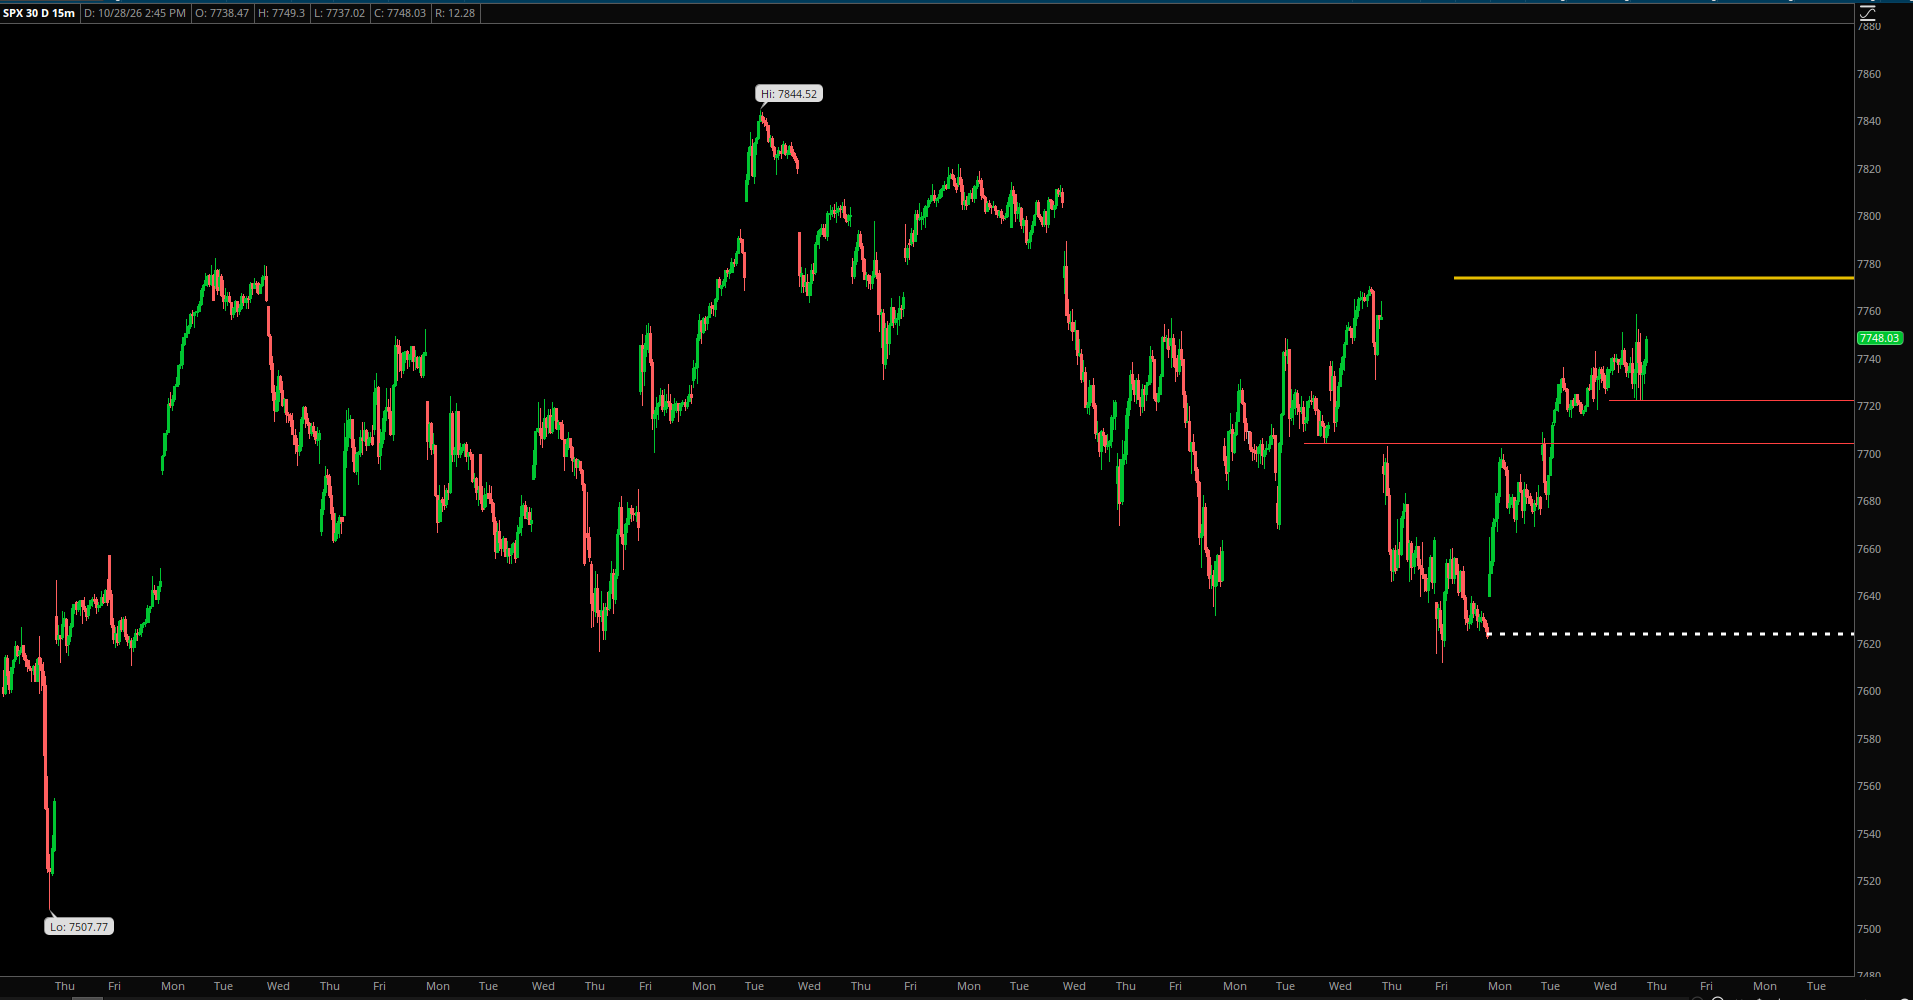
The smaller time frame on SPX also paints a similar picture. We broke below the trendline from Monday’s recovery, rejected all-time highs and saw a huge sell off from right around the level of last week’s close. It looks like SPX was going to be largely unchanged for the week, but instead we came all the way back down to the lower end of the expected move.

I talked at length yesterday about how /NQ has to be the leader in the market. While big tech was leading the way early this morning thanks to AAPL and some other MAG 7, it was very short lived and /NQ also rejected some critical levels.

We can see the grey box get rejected on /NQ as well. We basically filled the gap down from last week and headed right back down. We broke below some key support levels as well as the recovery channel from earlier in the week. The breach at the moment is very small, but still, something to keep in mind. Should this level fail to hold, it is a pretty big drop below to the next key level.
I said yesterday that AAPL had to be the savior for the market, and it looked like it was going to be just that when the market opened. However, AAPL opened at the high of the day and never saw that level again. I mentioned the 61.8% fib level yesterday being around $244 and today we saw that level get rejected hard.

So far, the head and shoulders pattern I spoke about earlier in the week is playing out in a near textbook fashion. The rejection at a critical fib level like the 61.8% retracement is just further confirmation.
I want to zoom into the 1-minute intra-day chart for AAPL just to emphasize the bearish price action today.

The opening print was literally the high of the day and we never saw a number anywhere close to that again for the rest of the day. It was a very orderly sell off of very clear lower lows and lower highs. We broke out of our grey box range, tried to retest it late afternoon and failed, as denoted by our first red arrow. Then we tried to test it again into the close and were not able to break back into it with any sort of conviction. We’re just grinding sideways along the lower end of it for now.
I will start with the minutely intra-day chart on NVDA as well to once again emphasize the bearish price action in big tech. The NVDA chart looks very similar to AAPL.

Open up strong and then sharply reverse down for the rest of the day, closing at the lows. NVDA was able to rally for a little bit longer than AAPL this morning, but the chart is largely the same.
Zooming out on NVDA a little, we can see that the grey box is nowhere near being tested. In fact, we are once again at the lower end of this most recent down move, forming what looks like a bear flag.

Zooming in even further, we can see that all week NVDA was just flagging sideways outside of the grey box, failing to make new highs or sustain any rally.

Overall, the price action does not look positive on any chart we explored today. SPX and NDX are failing key levels and breaking down, while AAPL and NVDA continue to be incredibly week and unable to sustain any upside momentum. In fact, the momentum is very clearly to the downside for those two. I won’t show a chart of MSFT for now, but it paints very similar picture especially post-earnings. That does not bode well for the 3 trillion-dollar club. The only 3 stocks over a market cap of 3 trillion dollars are showing weakness and breaking down.
We will explore more charts and key levels over the weekend in our expected range post soon to come. I’ll just close with some thoughts saying that I am no longer bullish on the market, but I am not bearish just yet either. I think caution is the play right now and the best thing to do is to have no positions until the market tells us where it is going. If we break above key resistance levels and sustain, then we have our answer and the market will rally. If we break down and head sharply towards new highs, then we probably have a swift and ugly down move coming.
The saving grace for the market this week was supposed to be the good economic data and strong tech earnings. Those things did not matter and now the market has no “good news” catalyst on the horizon for next week. GOOGL and AMZN are important earnings next week, but they won’t drive the market like AAPL or MSFT.
Stay tuned for more analysis over the weekend!
Leave a Reply